How to read graphs
Practice Questions
SSAT Upper Level Quantitative (Math) › How to read graphs
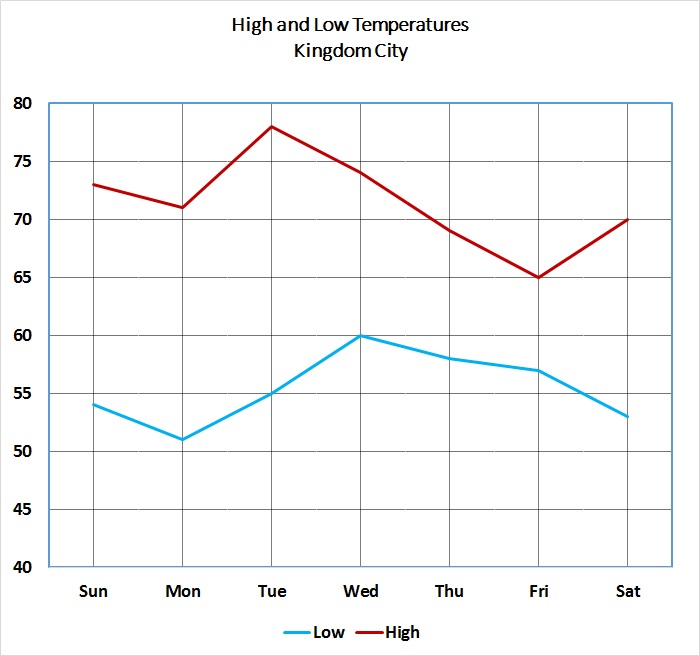
Refer to the above graph, which shows the high and low temperatures for Kingdom City over a one-week period. The temperatures at left are given in degrees Fahrenheit.
Temperatures given in degrees Fahrenheit can be converted to the Celsius scale using the formula
")
Express the lowest temperature of the week in degrees Celsius (nearest whole degree).
Refer to the above graph, which shows the high and low temperatures for Kingdom City over a one-week period. The temperatures at left are given in degrees Fahrenheit.
Temperatures given in degrees Fahrenheit can be converted to the Celsius scale using the formula
")
What was the difference, in degrees Celsius, between the highest temperature and the lowest temperature for the week (to the nearest whole degree)?
Refer to the above graph. Which of the following comes closest to the percent of increase in population enjoyed by Jones City between 1900 and 1950?

The above figure shows two black quarter-circles inscribed inside a rectangle. If the black region has area 200, what is the area of the white region (nearest tenth)?
Refer to the above graph, which shows the high and low temperatures for Kingdom City over a one-week period.
Which of the following temperatures occurred at least once on each of the seven days?
Refer to the above graph, which shows the high and low temperatures for Kingdom City over a one-week period.
Tim wants to know the high temperature for the Sunday of the next week. He does not have access to that information, but he knows that it was higher than those of exactly four of the five previous days, and lower than that of one of them. Which of the following temperatures could have been the high temperature for that day?