Interpretation of Tables and Graphs
Practice Questions
SSAT Upper Level Quantitative (Math) › Interpretation of Tables and Graphs
The menu of a local coffeehouse reads as follows:

A boss is treating his employees to drinks. Seven of them want iced tea, five want cafe latte, four want espresso, three want cappucino, one wants Americano, and one wants Turkish coffee. How much will the boss spend, disregarding tax?
The menu of a local coffeehouse reads as follows:
A boss is treating his employees to drinks. Seven of them want iced tea, five want cafe latte, four want espresso, three want cappucino, one wants Americano, and one wants Turkish coffee. How much will the boss spend, disregarding tax?
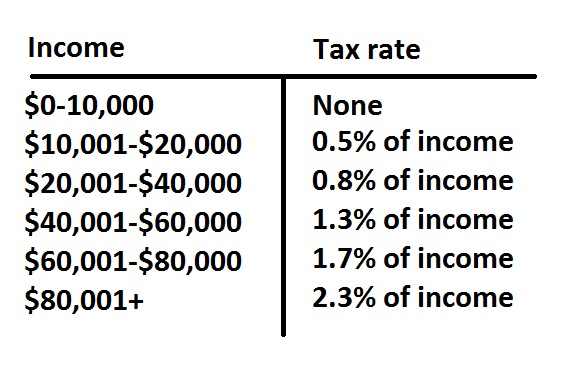
The above is an annual income tax table for married couples for a given state.
Mr. Phillips earned $27,287 last year; Mrs. Phillips earned $25,879. How much will the couple pay in income tax for that year (nearest hundred dollars)?
The above is an annual income tax table for married couples for a given state.
Mr. Phillips earned $27,287 last year; Mrs. Phillips earned $25,879. How much will the couple pay in income tax for that year (nearest hundred dollars)?
What is the probability of rolling a single die and it landing on 2 and 4?
What is the probability of rolling a single die and it landing on 2 and 4?
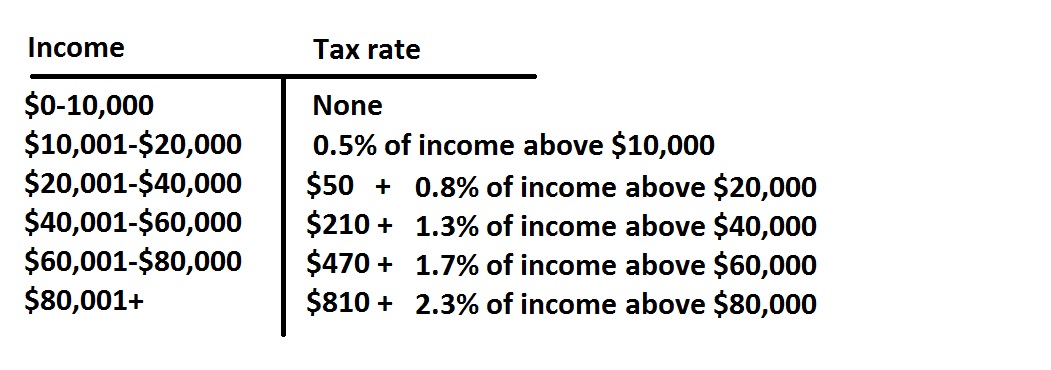
The above is an annual income tax table for married couples for a given state.
Mr. Clarke earned a monthly salary of 


The above is an annual income tax table for single persons in a given state.
Michael earned 


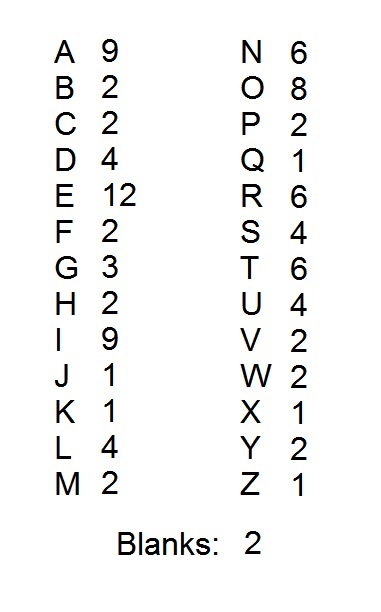
A popular word game uses one hundred tiles, each of which is marked with a letter or a blank. The distribution of the tiles is shown above, with each letter paired with the number of tiles marked with that letter. Notice that there are two blank tiles.
In the game, the four letters that are the most difficult to play are the "J", the "Q", the "X", and the "Z". John and Jane, who are in third grade, agree to remove these letters. After this is done, what percent of the letter tiles are marked with consonants (Note: "Y" counts as a consonant)?
| Column1 | Column2 |
|---|---|
| 1 | 0 |
| 2 | 0 |
| 3 | 2 |
| 4 | 3 |
| 5 | 4 |
| 6 | 5 |
| 7 | 8 |
| 8 | 8 |
| 9 | 8 |
| 10 | 8 |
| 11 | 5 |
| 12 | 0 |
Looking the the table given above, what is the range of the data set?