How to find the answer from a table - SSAT Middle Level Math
Card 0 of 20
The table below gives the number of students who scored in each of five ranges on a standardized test.

No student scored below 51.
What percent of the students scored 71 or better (nearest whole number)?
The table below gives the number of students who scored in each of five ranges on a standardized test.
No student scored below 51.
What percent of the students scored 71 or better (nearest whole number)?
Add the numbers of students whose scores fell in the 71-80, 81-90, and 91-100 ranges:

Now add the number of students who took the test.

To find what percent 161 is of 241, evaluate:

67% of the students scored 71 or better.
Add the numbers of students whose scores fell in the 71-80, 81-90, and 91-100 ranges:
Now add the number of students who took the test.
To find what percent 161 is of 241, evaluate:
67% of the students scored 71 or better.
Compare your answer with the correct one above
The table below gives the number of students who scored in each of five ranges on a standardized test.

No student scored below  .
.
What percent of the students scored  or less (nearest whole percent)?
The table below gives the number of students who scored in each of five ranges on a standardized test.
No student scored below
What percent of the students scored
Add the students who finished in the bottom two ranges ( --
-- and
and  ):
):

Now add all the students from all five ranges:

To figure out what percent of all of the students finished in the bottom two ranges, calculate:

The correct choice is  .
.
Add the students who finished in the bottom two ranges (
Now add all the students from all five ranges:
To figure out what percent of all of the students finished in the bottom two ranges, calculate:
The correct choice is
Compare your answer with the correct one above

Four candidates ran for mayor of Jackson City; the above circle graph shows the share of the vote that each won.
According to a city ordinance, a candidate must win more than 50% of the vote to win the election; if this does not happen, the two candidates who win the most votes will face each other in a runoff election. Based on the above graph, which of the following is the outcome of the vote?
By comparing the sizes of the sectors, it can be seen that Mills won the largest share of the vote - but not at least one half of it - and Jones won the second-largest share. Therefore, they will face each other in a runoff.
By comparing the sizes of the sectors, it can be seen that Mills won the largest share of the vote - but not at least one half of it - and Jones won the second-largest share. Therefore, they will face each other in a runoff.
Compare your answer with the correct one above
Five candidates ran for mayor of Madison City; the above circle graph shows the share of the vote that each won. Which of the following would be the most reasonable estimate of the percent of the vote Lyle won?
Five candidates ran for mayor of Madison City; the above circle graph shows the share of the vote that each won. Which of the following would be the most reasonable estimate of the percent of the vote Lyle won?
The sector representing Lyle is roughly one-tenth to one-eighth of the circle - in other words, 10-12 % of it. This is the approximate percent of the vote won by Lyle.
The sector representing Lyle is roughly one-tenth to one-eighth of the circle - in other words, 10-12 % of it. This is the approximate percent of the vote won by Lyle.
Compare your answer with the correct one above
Four candidates ran for mayor of Monroe City. The results are below.

According to a city ordinance, a candidate must win more than 50% of the vote to win the election; if this does not happen, the two candidates who win the most votes will face each other in a runoff election. Based on the above graph, which of the following is the outcome of the vote?
Four candidates ran for mayor of Monroe City. The results are below.
According to a city ordinance, a candidate must win more than 50% of the vote to win the election; if this does not happen, the two candidates who win the most votes will face each other in a runoff election. Based on the above graph, which of the following is the outcome of the vote?
We can determine whether the highest vote-getter, Boatwright, won the election outright by comparing Boatwright's votes to the sum of the votes of his opponents. The votes won by his opponents sum up to:

Boatwright won 8,542 votes. Since  , Boatwright won a majority, and thus won the election outright.
We can determine whether the highest vote-getter, Boatwright, won the election outright by comparing Boatwright's votes to the sum of the votes of his opponents. The votes won by his opponents sum up to:
Boatwright won 8,542 votes. Since
Compare your answer with the correct one above
Four candidates ran for mayor of Johnston City. The results are below.

According to a city ordinance, a candidate must win more than 50% of the vote to win the election; if this does not happen, the two candidates who win the most votes will face each other in a runoff election. Based on the above table, which of the following is the outcome of the vote?
Four candidates ran for mayor of Johnston City. The results are below.
According to a city ordinance, a candidate must win more than 50% of the vote to win the election; if this does not happen, the two candidates who win the most votes will face each other in a runoff election. Based on the above table, which of the following is the outcome of the vote?
We can determine whether the highest vote-getter, Johnson, won the election outright by comparing Johnson's votes to the sum of the votes of his opponents. The votes won by his opponents sum up to:

Johnson won 5,813 votes. Since  , he did not win a majority, and he will face the second highest vote-getter, Allen, in a runoff.
We can determine whether the highest vote-getter, Johnson, won the election outright by comparing Johnson's votes to the sum of the votes of his opponents. The votes won by his opponents sum up to:
Johnson won 5,813 votes. Since
Compare your answer with the correct one above
Four candidates ran for mayor of Johnston City. The results are below.

Which of the following is the best estimate of the percent of the vote won by Johnson?
Four candidates ran for mayor of Johnston City. The results are below.
Which of the following is the best estimate of the percent of the vote won by Johnson?
Since we are asking for an estimate, one way to work this problem is to round each candidate's vote tally to the nearest thousand, then adding the rounded numbers:


Johnson's share of the vote is about 6,000 of those approximately 14,000 votes, or 
As a percent,  is equal to:


Therefore, 40% is the best estimate of the choices we are given.
Since we are asking for an estimate, one way to work this problem is to round each candidate's vote tally to the nearest thousand, then adding the rounded numbers:
Johnson's share of the vote is about 6,000 of those approximately 14,000 votes, or
As a percent,
Therefore, 40% is the best estimate of the choices we are given.
Compare your answer with the correct one above
Consider the table. On which day of the week is the combined total of Ben and Jason's TV viewing the greatest?
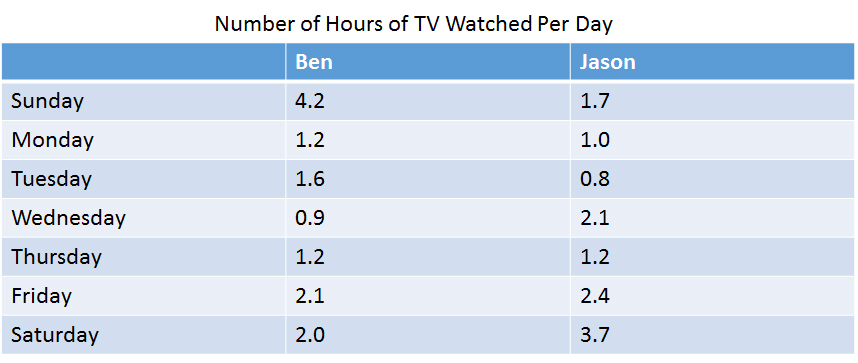
Consider the table. On which day of the week is the combined total of Ben and Jason's TV viewing the greatest?
On Sundays, Ben and Jason watch a total of 5.9 hours of TV:

They watch less TV on all other days: On Saturdays they watch 5.7 hours, on Fridays they watch 4.5 hours, and on Thursdays they watch 2.4 hours.
On Sundays, Ben and Jason watch a total of 5.9 hours of TV:
They watch less TV on all other days: On Saturdays they watch 5.7 hours, on Fridays they watch 4.5 hours, and on Thursdays they watch 2.4 hours.
Compare your answer with the correct one above
Below is the list of candidates for Student Council president, along with the number of votes each won:

What percent of the students voted for Jarrow (nearest tenth)?
Below is the list of candidates for Student Council president, along with the number of votes each won:
What percent of the students voted for Jarrow (nearest tenth)?
 students total voted. Out of those, 29 voted for Jarrow. To convert this to a percent, use this proportion and solve for
  :
:


Compare your answer with the correct one above
Below is the list of candidates for Student Council president, along with the number of votes each won:

What percent of the students voted for neither Phillips nor Young (nearest tenth)?
Below is the list of candidates for Student Council president, along with the number of votes each won:
What percent of the students voted for neither Phillips nor Young (nearest tenth)?
 students voted; of those students,
  voted for a candidate other than Phillip or Young. To convert this to a percent, use this proportion and solve for
  :
:


Compare your answer with the correct one above
Below is the list of candidates for Student Council president, along with the number of votes each won:

What percent of the votes (nearest whole number) were won by the third-place finisher?
Below is the list of candidates for Student Council president, along with the number of votes each won:
What percent of the votes (nearest whole number) were won by the third-place finisher?
Third place was won by Harris, who won 64 out of  votes. To rewrite this as a percent, solve this proportion statement for
  :
:


Third place was won by Harris, who won 64 out of
Compare your answer with the correct one above
The above circle graph shows the results of a school election. According to the rules, the election falls to the student who wins the majority of the votes; if no student wins a majority, the top two vote-getters will face each other in a runoff, with the winner being elected.
Which of the following is the result of this election?
Since each of the six portions of the graph takes up less than half, no one won a majority. Therefore, there will be a runoff. The two largest portions are light blue (Phelps) and orange (Creighton), so Phelps and Creighton got the most and second-most votes, and they will face each other in a runoff.
Since each of the six portions of the graph takes up less than half, no one won a majority. Therefore, there will be a runoff. The two largest portions are light blue (Phelps) and orange (Creighton), so Phelps and Creighton got the most and second-most votes, and they will face each other in a runoff.
Compare your answer with the correct one above
The above circle graph shows the results of a school election. According to the rules, the office of President falls to the student who wins the most votes, and the office of Vice-President falls to the student who finishes second. A runoff only happens in case of a tie.
Which of the following is the result of this election?
The two largest portions of the pie graph are light blue (Phelps) and orange (Creighton); Phelps got the most votes and Creighton got the second-most. Therefore, Phelps was elected President and Creighton was elected Vice-President - there will be no runoffs.
The two largest portions of the pie graph are light blue (Phelps) and orange (Creighton); Phelps got the most votes and Creighton got the second-most. Therefore, Phelps was elected President and Creighton was elected Vice-President - there will be no runoffs.
Compare your answer with the correct one above
The above circle graph shows the results of a school election. According to the rules, the office of President falls to the student who wins the most votes; the office of Vice-President falls to the student who finishes second; the office of Secretary-Treasurer falls to the student who finishes third. A runoff only happens in case of a tie.
Which candidate was elected Secretary-Treasurer?
The third-largest portion of the circle graph is gray, which, according to the legend, corresponds to Wells's share of the vote. Wells was elected Secretary-Treasurer outright.
The third-largest portion of the circle graph is gray, which, according to the legend, corresponds to Wells's share of the vote. Wells was elected Secretary-Treasurer outright.
Compare your answer with the correct one above
Below is a table that gives the population of Washington City for six census years.

Which of the following decades saw the greatest growth in the city's population?
Below is a table that gives the population of Washington City for six census years.
Which of the following decades saw the greatest growth in the city's population?
For each decade, take the difference of the population of the last year and that of the first year. We can omit 1990 to 2000, as the population declined over that decade.
1960-70: 
1970-80: 
1980-90: 
2000-10: 
The greatest growth occurred between 2000 and 2010.
For each decade, take the difference of the population of the last year and that of the first year. We can omit 1990 to 2000, as the population declined over that decade.
1960-70:
1970-80:
1980-90:
2000-10:
The greatest growth occurred between 2000 and 2010.
Compare your answer with the correct one above
Mrs. Smith’s class made a line plot to show the amount of sugar that each student has in a given day.
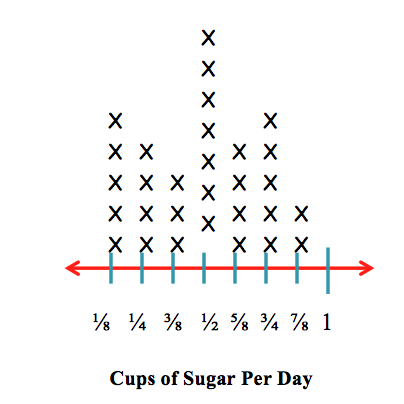
How many students have  cups of sugar?
Mrs. Smith’s class made a line plot to show the amount of sugar that each student has in a given day.
How many students have
Each X represents one person. There are  Xs above the
  tick mark on the line plot.
Each X represents one person. There are
Compare your answer with the correct one above
Mrs. Smith’s class made a line plot to show the amount of sugar that each student consumes in a given day.
How many students consume  cup of sugar?
Mrs. Smith’s class made a line plot to show the amount of sugar that each student consumes in a given day.
How many students consume
Each X represents one person. There are  Xs above the
  tick mark on the line plot.
Each X represents one person. There are
Compare your answer with the correct one above
Mrs. Smith’s class made a line plot to show the amount of sugar that each student has in a given day.
How many students have  of a cup of sugar?
Mrs. Smith’s class made a line plot to show the amount of sugar that each student has in a given day.
How many students have
Each X represents one person. There are  Xs above the
  tick mark on the line plot.
Each X represents one person. There are
Compare your answer with the correct one above
Mrs. Smith’s class made a line plot to show the amount of sugar that each student has in a given day.
How many students have  of a cup of sugar?
Mrs. Smith’s class made a line plot to show the amount of sugar that each student has in a given day.
How many students have
Each X represents one person. There are  Xs above the
  tick mark on the line plot.
Each X represents one person. There are
Compare your answer with the correct one above