Venn Diagrams - SSAT Middle Level Math
Card 0 of 20
The Venn diagram above, shows the results from a recent survey. The respondents were asked whether they enjoy playing video games, reading, or both. What percentage of the survey respondents enjoy both video games and reading?
The Venn diagram above, shows the results from a recent survey. The respondents were asked whether they enjoy playing video games, reading, or both. What percentage of the survey respondents enjoy both video games and reading?
The total number of survey respondents is equal to  percent.
Since the common part of the Venn diagram represents the respondents that enjoy both video games and reading, the solution is:
=")

The total number of survey respondents is equal to
Since the common part of the Venn diagram represents the respondents that enjoy both video games and reading, the solution is:
Compare your answer with the correct one above
The above Venn diagram depicts the number of students that: only play at the Rec. Center after school, only play at the park after school, and the students that play at both locations after school.
How many students play at both the park and Rec. Center after school?
The above Venn diagram depicts the number of students that: only play at the Rec. Center after school, only play at the park after school, and the students that play at both locations after school.
How many students play at both the park and Rec. Center after school?
To solve this problem, locate the common part of this Venn diagram. Since each of the two outside portions of the Venn diagram represent students that only play at either the park or Rec. Center.
The  students in the common area of the Venn diagram, play both at the park and at the Rec. Center.
To solve this problem, locate the common part of this Venn diagram. Since each of the two outside portions of the Venn diagram represent students that only play at either the park or Rec. Center.
The
Compare your answer with the correct one above
Using the Venn diagram above, what fraction of the respondents play at both the Rec. Center and the park. (Keep in mind that the two outside portions of the Venn diagram represent respondents that only play at one location or the other).
Using the Venn diagram above, what fraction of the respondents play at both the Rec. Center and the park. (Keep in mind that the two outside portions of the Venn diagram represent respondents that only play at one location or the other).
To solve this problem, locate the common part of this Venn diagram. Since each of the two outside portions of the Venn diagram represent students that only play at either the park or Rec. Center. The  students in the common area of the Venn diagram belong to the group that plays at both the park and the Rec. Center.
This means that the total number of students (the denominator) must equal:

Making  the correct answer.
To solve this problem, locate the common part of this Venn diagram. Since each of the two outside portions of the Venn diagram represent students that only play at either the park or Rec. Center. The
This means that the total number of students (the denominator) must equal:
Making
Compare your answer with the correct one above
The Venn diagram shown above represents the number of students that: only took math during summer school, only took social studies during summer school, and the number of students that took both math and social studies during summer school.
How many students took both math and social studies?
The Venn diagram shown above represents the number of students that: only took math during summer school, only took social studies during summer school, and the number of students that took both math and social studies during summer school.
How many students took both math and social studies?
The common portion of this Venn diagram is equal to  , which depicts the number of students that took both math and social studies during summer school.
The common portion of this Venn diagram is equal to
Compare your answer with the correct one above
What fraction of the above Venn diagram represents the number of students that took both math and social studies during summer school?
What fraction of the above Venn diagram represents the number of students that took both math and social studies during summer school?
The common portion of this Venn diagram is equal to  , which depicts the number of students that took both math and social studies during summer school.
The denominator of the fraction is equal to the total number of students: \

Thus,

The common portion of this Venn diagram is equal to
The denominator of the fraction is equal to the total number of students: \
Thus,
Compare your answer with the correct one above
Using the Venn diagram shown above, what fraction represents the amount of students that enjoy both reading and playing video games?
Using the Venn diagram shown above, what fraction represents the amount of students that enjoy both reading and playing video games?
The total number of survey respondents is equal to percent. Since the common part of the Venn diagram represents the respondents that enjoy both video games and reading, the solution is:
Thus,  percent is equal to
The total number of survey respondents is equal to
Thus,
Compare your answer with the correct one above
Using the Venn diagram above shows whether respondents only like Super Hero  , only like Super Hero
  , or if they like both Super Heroes. What percentage of respondents like both Super Heroes?
Using the Venn diagram above shows whether respondents only like Super Hero
The total number of survey respondents is equal to percent. Since the common part of the Venn diagram represents the respondents that like both Super Heroes.
Thus, the solution is:
=")

The total number of survey respondents is equal to
Thus, the solution is:
Compare your answer with the correct one above
The Venn diagram shown above displays whether respondents only use Social Media site  , only use Social Media site
  , or use both of the Social Media sites.
What percent of respondents use both Social Media sites?
The Venn diagram shown above displays whether respondents only use Social Media site
What percent of respondents use both Social Media sites?
The total number of survey respondents is equal to percent. Since the common part of the Venn diagram represents the respondents that use both of the Social Media sites, the solution is:
=")

The total number of survey respondents is equal to
Compare your answer with the correct one above
What fraction represents the amount of respondents that use both Social Media site  and Social Media site
  ?
?
What fraction represents the amount of respondents that use both Social Media site
The total number of survey respondents is equal to percent. Since the common part of the Venn diagram represents the respondents that use both social media sites, the solution is:
=")


The total number of survey respondents is equal to
Compare your answer with the correct one above
The above Venn diagram shows the amount of survey respondents that only like tacos, only like tamales, and those that like both tacos and tamales.
What fraction of respondents like both tacos and tamales?
The above Venn diagram shows the amount of survey respondents that only like tacos, only like tamales, and those that like both tacos and tamales.
What fraction of respondents like both tacos and tamales?
The total number of survey respondents is equal to percent, which equals  .
.
The total number of respondents that do not like both tacos and tamales:  .
.
The remaining amount equals the respondents that like both tacos and tamales.
Thus, the solution is:

The total number of survey respondents is equal to
The total number of respondents that do not like both tacos and tamales:
The remaining amount equals the respondents that like both tacos and tamales.
Thus, the solution is:
Compare your answer with the correct one above
The above Venn diagram shows the amount of survey respondents that only like tacos, only like tamales, and those that like both tacos and tamales.
What percent of the respondents like both tamales and tacos?
The above Venn diagram shows the amount of survey respondents that only like tacos, only like tamales, and those that like both tacos and tamales.
What percent of the respondents like both tamales and tacos?
The total number of survey respondents is equal to percent, which equals  .
.
The total number of respondents that do not like both tacos and tamales:  .
.
The remaining amount equals the respondents that like both tacos and tamales.
Thus, the solution is:

Now we need to convert the fraction into a percent.

The total number of survey respondents is equal to
The total number of respondents that do not like both tacos and tamales:
The remaining amount equals the respondents that like both tacos and tamales.
Thus, the solution is:
Now we need to convert the fraction into a percent.
Compare your answer with the correct one above

The above Venn diagram shows the results from a recent survey. Respondents had the choice of being only a fan of TEAM  , only a fan of TEAM
  , or a fan of both of the teams. What percentage of the respondents are fans of both the teams?
The above Venn diagram shows the results from a recent survey. Respondents had the choice of being only a fan of TEAM
In order to find the value of the common area of this Venn diagram, find the sum of  percent and
  percent.
Then find the difference from the sum to  percent.
The solution is:


In order to find the value of the common area of this Venn diagram, find the sum of
Then find the difference from the sum to
The solution is:
Compare your answer with the correct one above
See the above Venn diagram. Which of the following sets is represented by the gray region?
See the above Venn diagram. Which of the following sets is represented by the gray region?
The shaded area represents the set of all elements that are both in  and not in
  . This the intersection of
  and the complement of
  , or
, or  .
.
The shaded area represents the set of all elements that are both in
Compare your answer with the correct one above

See the above Venn diagram. Which of the following sets is represented by the gray region?
See the above Venn diagram. Which of the following sets is represented by the gray region?
The gray region represents all elements that either are in  , are not in
  - that is, are in
  - or both. This is the union of
  and
and  , or
, or  .
.
The gray region represents all elements that either are in
Compare your answer with the correct one above

Let set  , the set of all natural numbers.
 = {
= { |
|  is a multiple of 6 }
 = {
= { |
|  is a multiple of 9 }
Which of the following numbers would appear in the gray region of the Venn diagram?
Let set
Which of the following numbers would appear in the gray region of the Venn diagram?
The gray area represents the portion of  that is not in
  - in other words, all multiples of 9 that are not also multiples of 6.


Therefore, 4,572, 3,438, and 8,544 can be eliminated.
 , so 9,349 can be eliminated because it isn't a multiple of 9.
 and
and  , so, as both a nonmultiple of 6 and a multiple of 9, 4.077 is the correct choice.
The gray area represents the portion of
Therefore, 4,572, 3,438, and 8,544 can be eliminated.
Compare your answer with the correct one above
Given the Venn diagram below, which of the following does not belong to  ?
?
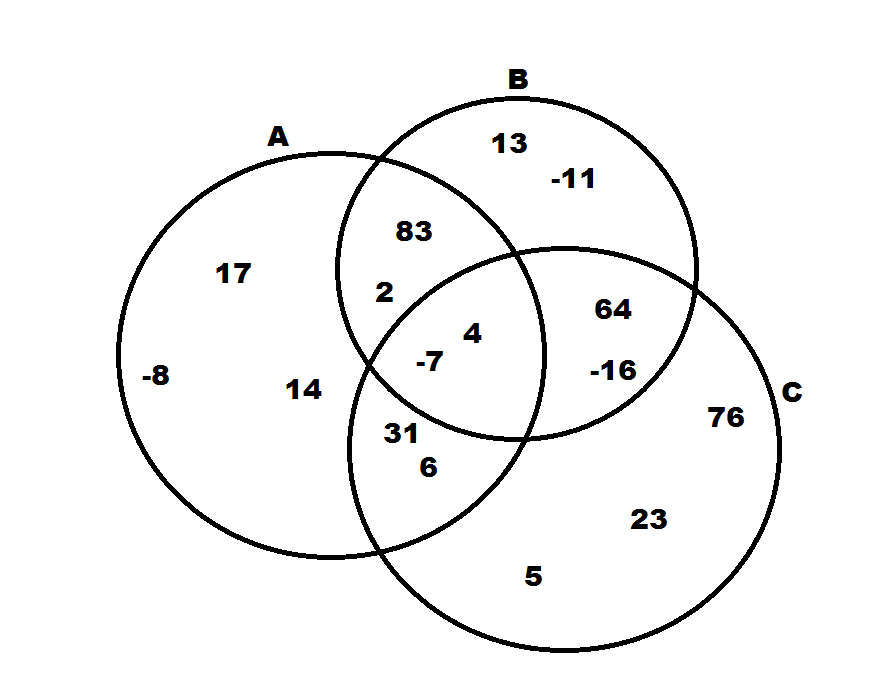
Given the Venn diagram below, which of the following does not belong to
The symbol  stands for the union between two sets. Therefore,
  means the set of all numbers that are in either A or B. Looking at our choices, the only number that isn't in either A, B, or both is 23.
The symbol
Compare your answer with the correct one above

The above Venn diagram represents survey respondents from a recent political poll. Based on the respondent's political affiliation, they were classified into group  only,
only,  only or both groups.
What percentage of the respondents were classified into both groups?
The above Venn diagram represents survey respondents from a recent political poll. Based on the respondent's political affiliation, they were classified into group
What percentage of the respondents were classified into both groups?
The common portion of this Venn diagram represents the percentage of respondents that were classified into both groups. In order to calculate the percentage that represents the amount of respondents classified into both groups, first find the sum of group  and group
  . Then subtract that quantity from
  percent.
The solution is:


The common portion of this Venn diagram represents the percentage of respondents that were classified into both groups. In order to calculate the percentage that represents the amount of respondents classified into both groups, first find the sum of group
The solution is:
Compare your answer with the correct one above
The above Venn diagram represents survey respondents from a recent political poll. Based on the respondent's political affiliation, they were classified into group only, only or both groups.
What fraction of respondents were classified into only group  ?
?
The above Venn diagram represents survey respondents from a recent political poll. Based on the respondent's political affiliation, they were classified into group
What fraction of respondents were classified into only group
Since the information provided in the Venn diagram represents percentages, convert the quantity in category  from a percentage to a fraction. To convert a percentage to a fraction, divide the percent by a divisor of
  , then simplify the fraction if applicable; however, in this case the fraction can't be reduced.
The solution is:
Group 
Thus:

Since the information provided in the Venn diagram represents percentages, convert the quantity in category
The solution is:
Group
Thus:
Compare your answer with the correct one above

The above Venn diagram represents the total number of respondents from a survey administered in  . Respondents were categorized into only group
  , only group
  or both of the groups.
What percentage of respondents were categorized into only group 
The above Venn diagram represents the total number of respondents from a survey administered in
What percentage of respondents were categorized into only group
To find the missing quantity for category  , first calculate the sum from the common portion of the Venn diagram and category
  . Then, subtract that sum from
  , because the total percentage of respondents must equal
  .
.
The algebraic solution is:


To find the missing quantity for category
The algebraic solution is:
Compare your answer with the correct one above
The above Venn diagram represents the total number of respondents from a survey administered in . Respondents were categorized into only group , only group or both of the groups.
What fraction of the respondents were categorized into both groups?
The above Venn diagram represents the total number of respondents from a survey administered in
What fraction of the respondents were categorized into both groups?
Since the information provided in the Venn diagram represents percentages, convert the quantity in the common portion of the diagram from a percentage to a fraction. To convert a percentage to a fraction, divide the percentage by a divisor of , then simplify the fraction if possible.
Common portion is equal to  . Therefore, the solution is:

Since the information provided in the Venn diagram represents percentages, convert the quantity in the common portion of the diagram from a percentage to a fraction. To convert a percentage to a fraction, divide the percentage by a divisor of
Common portion is equal to
Compare your answer with the correct one above