How to find the answer from a table
Practice Questions
SSAT Middle Level Math › How to find the answer from a table
The table below gives the number of students who scored in each of five ranges on a standardized test.

No student scored below 51.
What percent of the students scored 71 or better (nearest whole number)?
The above circle graph shows the results of a school election. According to the rules, the office of President falls to the student who wins the most votes, and the office of Vice-President falls to the student who finishes second. A runoff only happens in case of a tie.
Which of the following is the result of this election?
The above circle graph shows the results of a school election. According to the rules, the office of President falls to the student who wins the most votes; the office of Vice-President falls to the student who finishes second; the office of Secretary-Treasurer falls to the student who finishes third. A runoff only happens in case of a tie.
Which candidate was elected Secretary-Treasurer?
Below is the list of candidates for Student Council president, along with the number of votes each won:

What percent of the votes (nearest whole number) were won by the third-place finisher?
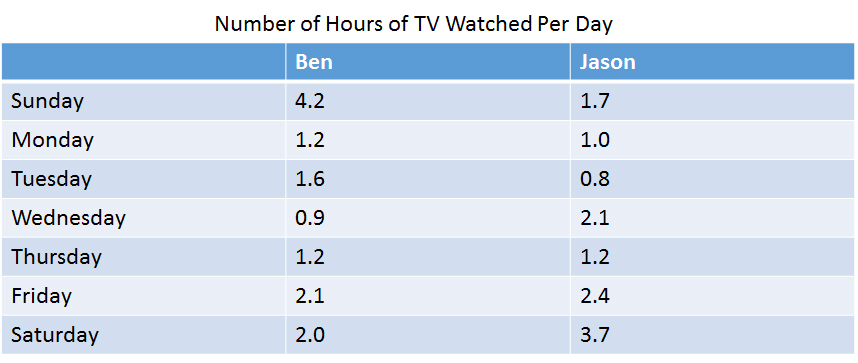
Consider the table. On which day of the week is the combined total of Ben and Jason's TV viewing the greatest?

Four candidates ran for mayor of Jackson City; the above circle graph shows the share of the vote that each won.
According to a city ordinance, a candidate must win more than 50% of the vote to win the election; if this does not happen, the two candidates who win the most votes will face each other in a runoff election. Based on the above graph, which of the following is the outcome of the vote?
Five candidates ran for mayor of Madison City; the above circle graph shows the share of the vote that each won. Which of the following would be the most reasonable estimate of the percent of the vote Lyle won?
Mrs. Smith’s class made a line plot to show the amount of sugar that each student consumes in a given day.
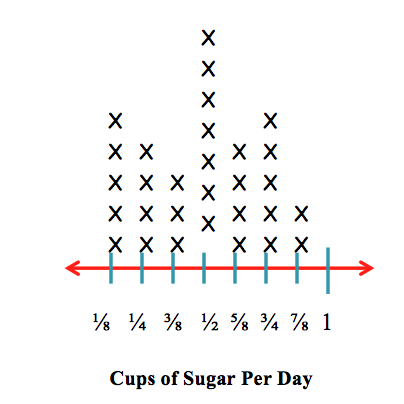
How many students consume 
The above circle graph shows the results of a school election. According to the rules, the election falls to the student who wins the majority of the votes; if no student wins a majority, the top two vote-getters will face each other in a runoff, with the winner being elected.
Which of the following is the result of this election?
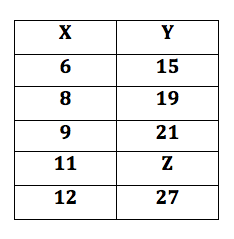
Find