Understanding Functions
Practice Questions
SAT Math › Understanding Functions
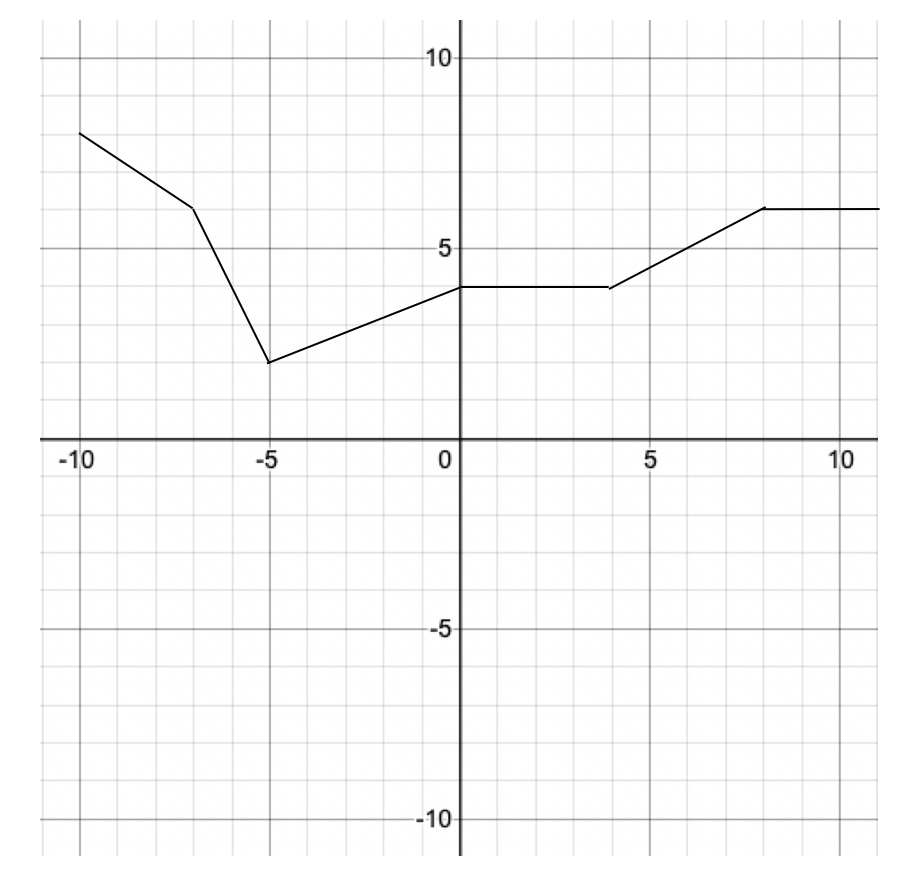
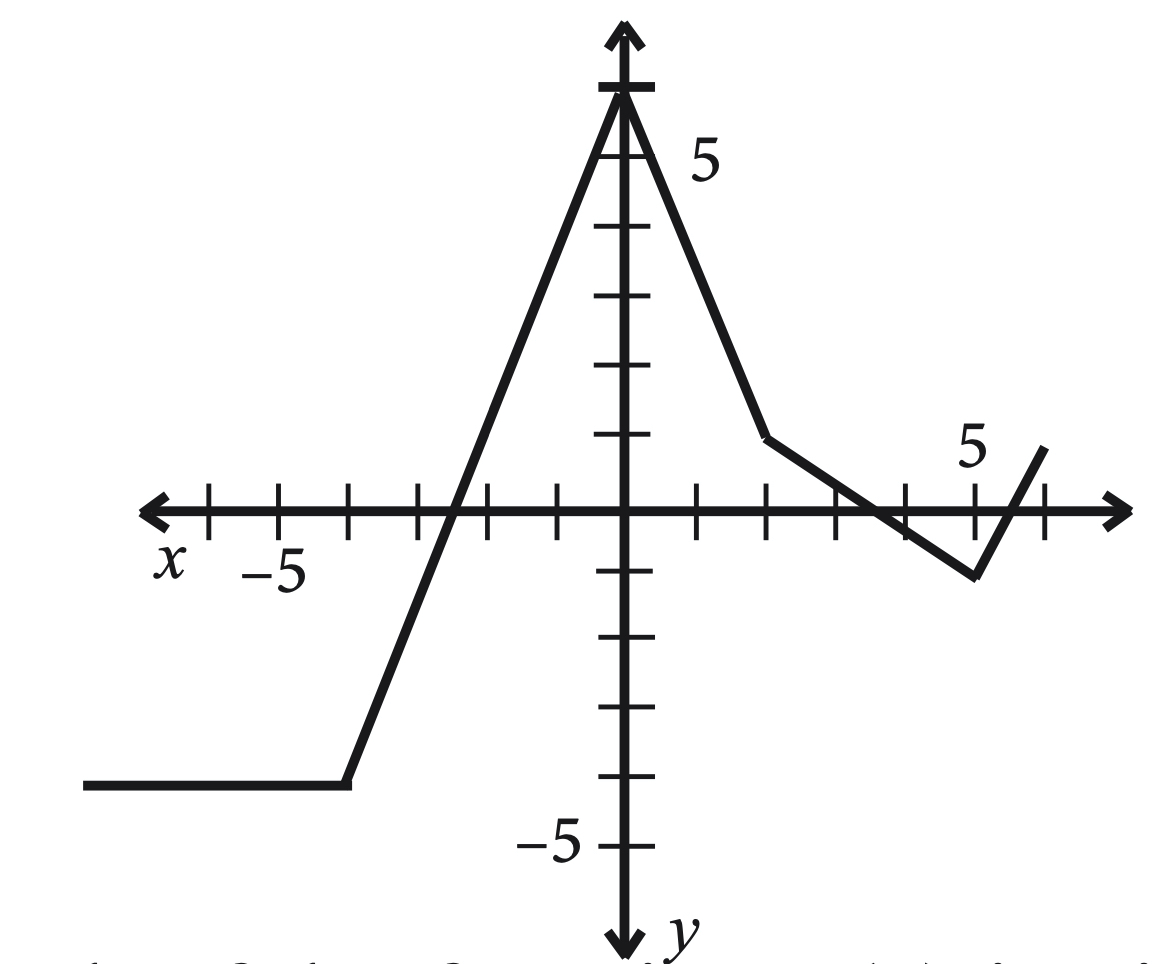
The function f(x) is shown above for all the numbers within its domain. What is the value of the function when it is at its minimum?
If n is a constant in the function f(x) = nx + 5, and f(14) = -2, what is f(2)?
The polynomial function ")


")

The graph of the function f(x) is given above for all numbers within its domain. At approximately what value of x is the function at its minimum?
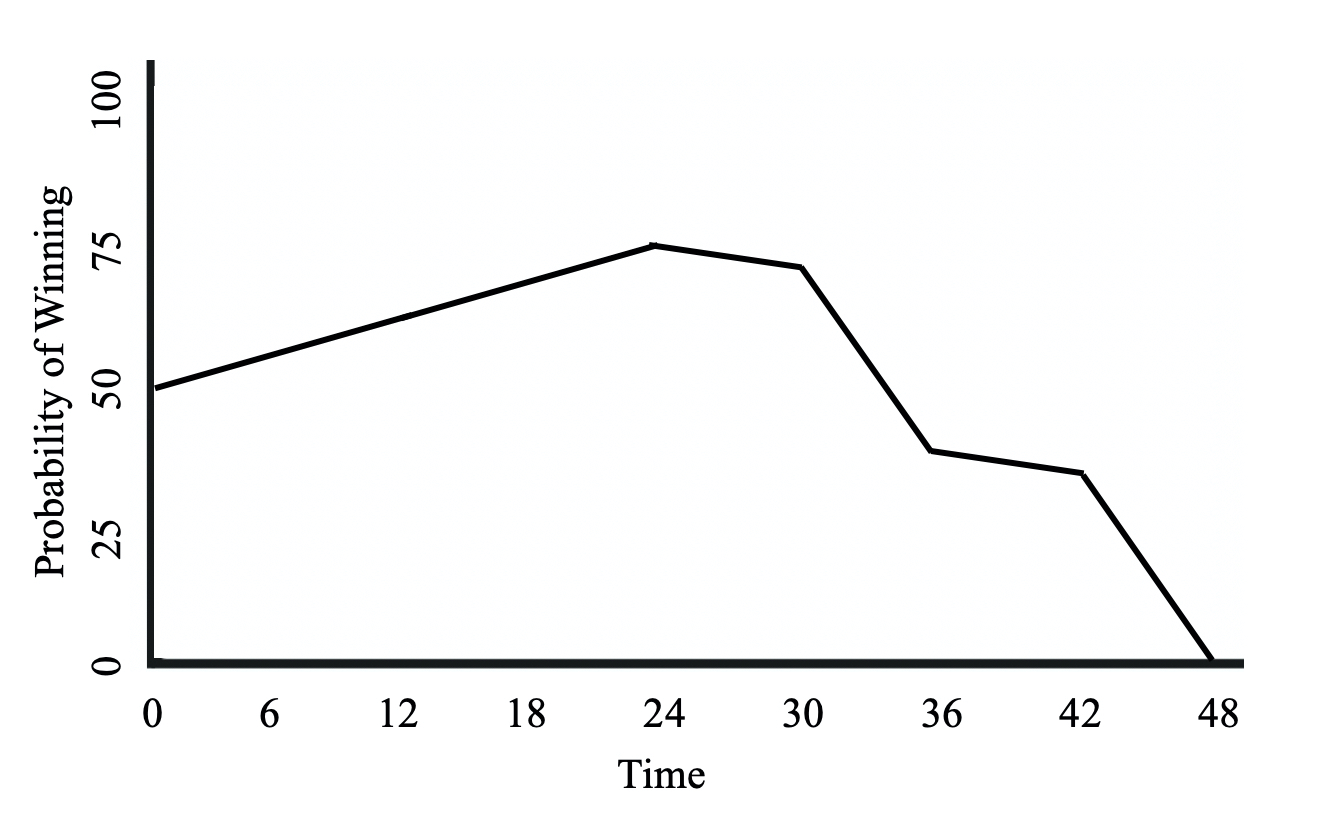
The graph above is a function of a basketball team's probability of winning (shown on the y-axis) as a function of the time elapsed during a 48-minute game (shown on the x-axis). Which of the following best describes the team's performance during the game?
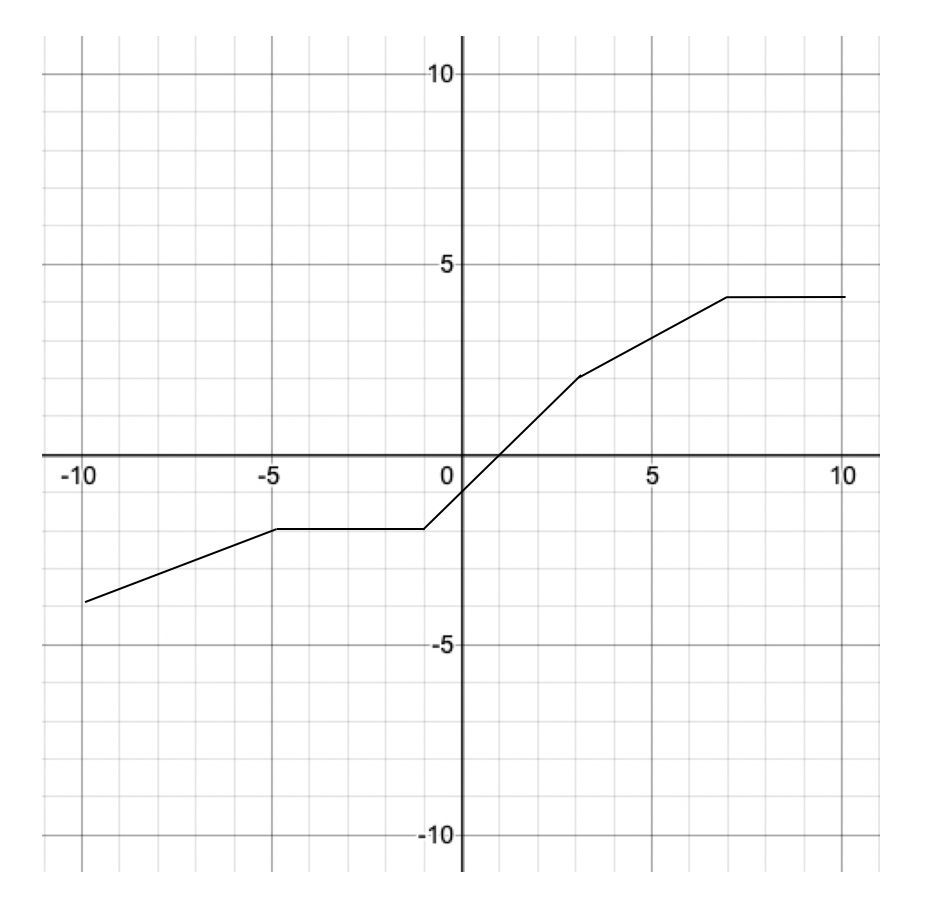
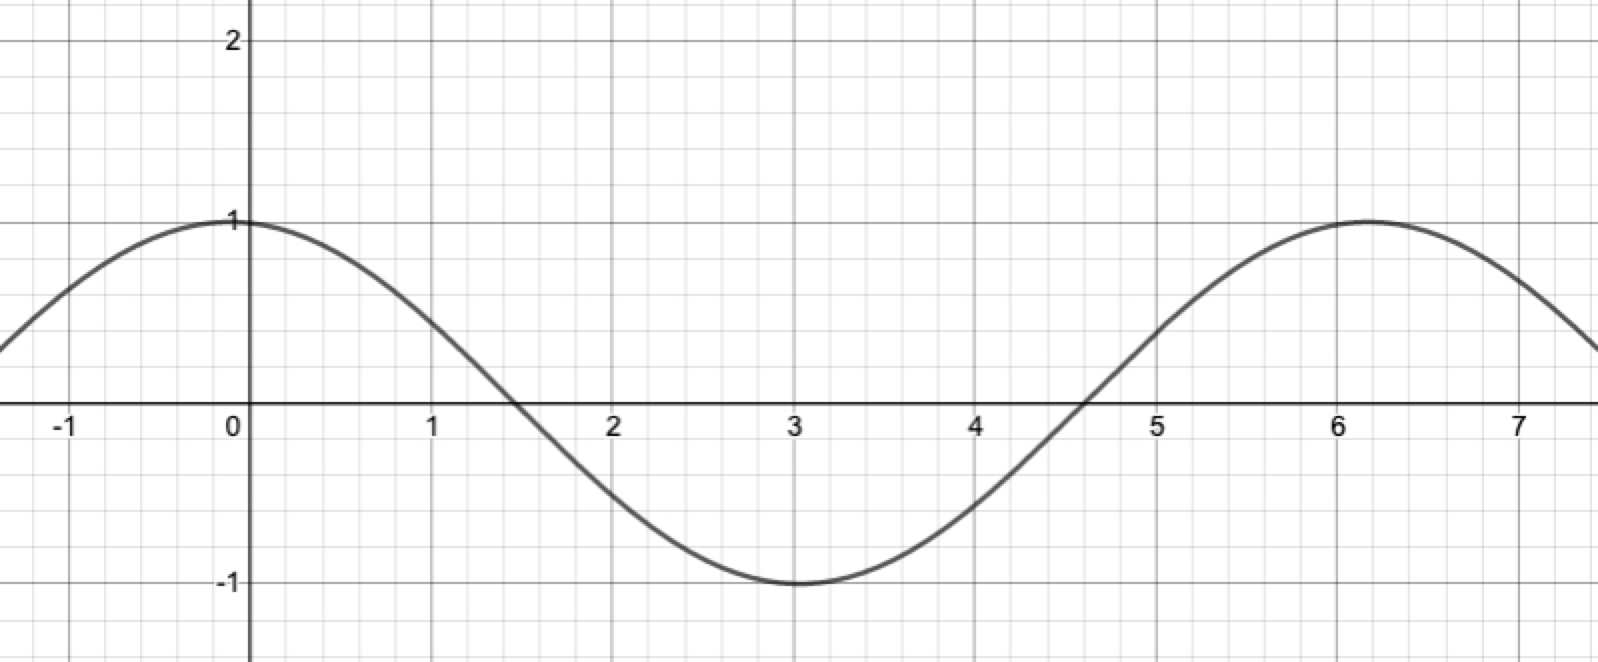
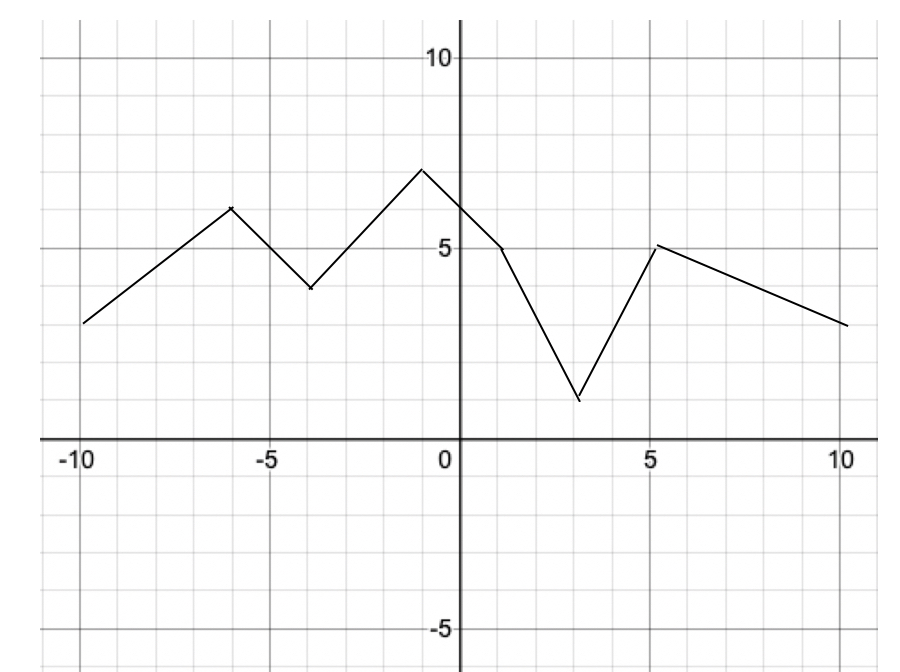
The graph of the function g(x) is given above for all numbers within its domain. At what value of x does the function equal zero?
The graph of the function ")

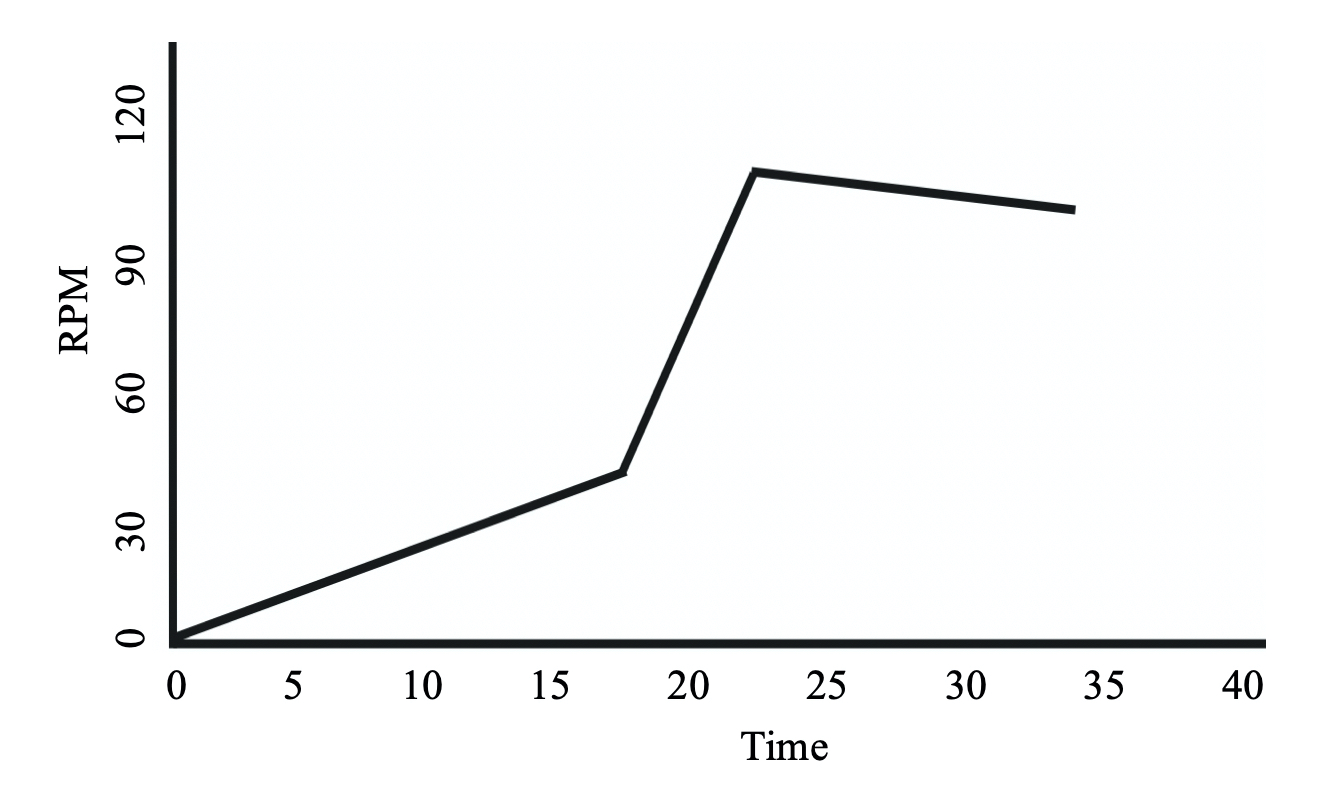
The graph above plots Jessica's workout in a 35-minute spin class, with her number of pedal revolutions per minute (RPM) graphed as a function of elapsed time. Approximately how many minutes into the workout was her revolutions per minute the highest?
The graph of the function ")

The graph of the function f(x) is given above for all numbers within its domain. At what value of x is the function at its minimum?