Graphing Inequalities
Practice Questions
SAT Math › Graphing Inequalities
If the system of inequalities 

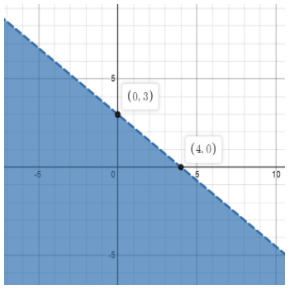
The graph shown above is best represented by which inequality?
For the following system of equations, what shape does the corresponding graph make:

If the system of inequalities 

Which of the following graphs correctly describes the system of inequalities:


Which of the following are solutions to the system of equations 

I)
")
II)
")
III)
")
For the following system of equations, what shape does the corresponding graph make:

If the system of inequalities 

Which of the following graphs correctly describes the system of inequalities:


Which of the following ordered pairs (x,y) is a solution to the system of inequalities:

