How to graph a function
Practice Questions
SAT Math › How to graph a function
Questions
8
1
=2x+4")
Which of the following graphs represents the x-intercept of this function?
2
=2x+4")
Which of the following graphs represents the y-intercept of this function?
3
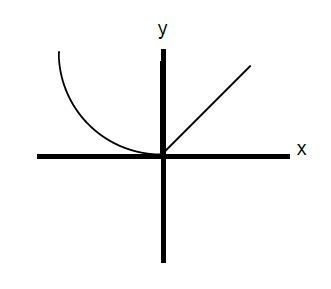
The figure above shows the graph of y = f(x). Which of the following is the graph of y = |f(x)|?
4
Below is the graph of the function ")
Which of the following could be the equation for ")
5
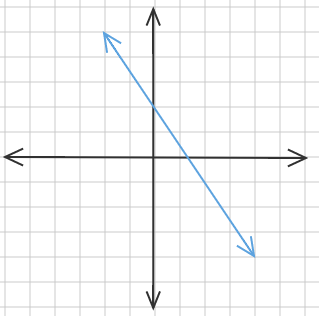
What is the equation for the line pictured above?
6
Which of the following could be a value of 
7
Which of the following represents =\frac{1}{2}x-2")
8
The graphic shows Bob's walk. At what times is Bob the furthest from home?
