Data Analysis and Statistics - SAT Subject Test in Math II
Card 0 of 20
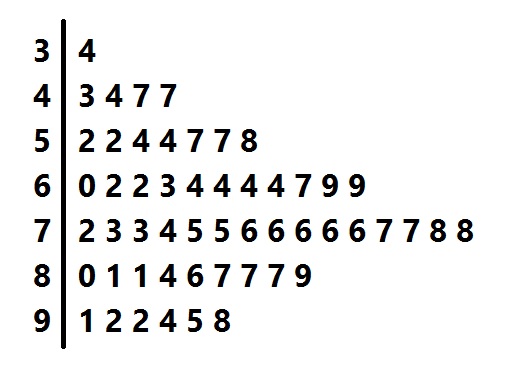
Above is the stem-and-leaf display for a group of test scores. Order the mean, the median, and the mode of the scores from least to greatest.
Above is the stem-and-leaf display for a group of test scores. Order the mean, the median, and the mode of the scores from least to greatest.
The scores represented can be found from matching the tens digits in the "stem" to the units digits that form the "leaves" in their row. For example, the "leaves" in the "5" row are "2 2 4 4 7 7 8", so the scores will be 52, 52, 54, 54, 57, 57, and 58.
There are 53 scores represented, so to find the median, look for the middle score, in position
 .
.
As can be seen in this diagram, the score - the median - is 74.
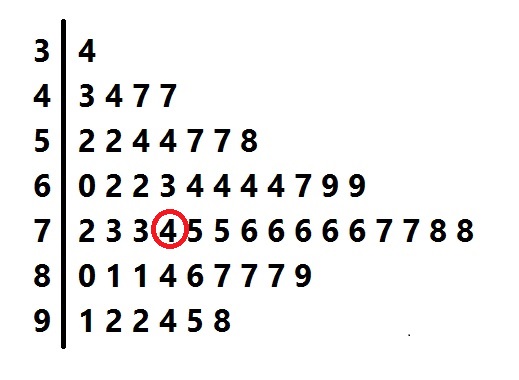
The most frequently occurring "leaf" is the "6" in the "7" row, so the mode is 76.
The mean is the sum of the scores divided by 53. If we add the scores, we get
 , the mean is

In ascending order, the values are mean, median, mode.
The scores represented can be found from matching the tens digits in the "stem" to the units digits that form the "leaves" in their row. For example, the "leaves" in the "5" row are "2 2 4 4 7 7 8", so the scores will be 52, 52, 54, 54, 57, 57, and 58.
There are 53 scores represented, so to find the median, look for the middle score, in position
As can be seen in this diagram, the score - the median - is 74.
The most frequently occurring "leaf" is the "6" in the "7" row, so the mode is 76.
The mean is the sum of the scores divided by 53. If we add the scores, we get
In ascending order, the values are mean, median, mode.
Compare your answer with the correct one above
Find the mean of the following data set:

Find the mean of the following data set:
Find the mean of the following data set:

To find the mean, add up all the terms and divide by the total number of terms.
We have 9 terms, so our denominator will be 9.

So our mean is 67.33
Find the mean of the following data set:
To find the mean, add up all the terms and divide by the total number of terms.
We have 9 terms, so our denominator will be 9.
So our mean is 67.33
Compare your answer with the correct one above
Find the mode of the data set.
")
Find the mode of the data set.
The mode of a data set is the data point(s) that appear the most often.
In the data set for this problem, both 4 and 5 appear twice, and no other number appears more than twice.
")
So for this data set there are two modes, 4 and 5.
The mode of a data set is the data point(s) that appear the most often.
In the data set for this problem, both 4 and 5 appear twice, and no other number appears more than twice.
So for this data set there are two modes, 4 and 5.
Compare your answer with the correct one above
Find the mean of the following numbers: 
Find the mean of the following numbers:
The mean is the average of all the number in the data set.

The answer is: 
The mean is the average of all the number in the data set.
The answer is:
Compare your answer with the correct one above
Find the mean of the numbers: 
Find the mean of the numbers:
The mean is the average of all the numbers given.
Add all the numbers and divide the total by five.

The answer is: 
The mean is the average of all the numbers given.
Add all the numbers and divide the total by five.
The answer is:
Compare your answer with the correct one above
Determine the mean: 
Determine the mean:
The mean is the average of all numbers in the data set.
Add the numbers, and divide the total sum by four, since there are four numbers.
}{4} = \frac{20}{4} =5")
The answer is: 
The mean is the average of all numbers in the data set.
Add the numbers, and divide the total sum by four, since there are four numbers.
The answer is:
Compare your answer with the correct one above
Determine the mean of the three numbers: 
Determine the mean of the three numbers:
The mean is the average of the numbers provided.
Sum the numbers and divide the sum by three.

The answer is: 
The mean is the average of the numbers provided.
Sum the numbers and divide the sum by three.
The answer is:
Compare your answer with the correct one above
Find the median of the following data set:

Find the median of the following data set:
Find the median of the following data set:

First, put the numbers in ascending order:

Next, identify the median by identifying the middle term.

So, our median is 67.
Find the median of the following data set:
First, put the numbers in ascending order:
Next, identify the median by identifying the middle term.
So, our median is 67.
Compare your answer with the correct one above
Determine the median of the following numbers: 
Determine the median of the following numbers:
Order the numbers from least to greatest.

The median of a even set of numbers is the average of the central two numbers.

The answer is: 
Order the numbers from least to greatest.
The median of a even set of numbers is the average of the central two numbers.
The answer is:
Compare your answer with the correct one above
Determine the median of the numbers: 
Determine the median of the numbers:
The numbers provided are already in chronological order.
Since we have an even set of numbers, the median of the numbers is the average of the two central numbers.

Do not confuse the meaning of mean and median!
The answer is: 
The numbers provided are already in chronological order.
Since we have an even set of numbers, the median of the numbers is the average of the two central numbers.
Do not confuse the meaning of mean and median!
The answer is:
Compare your answer with the correct one above
Determine the median of the numbers: 
Determine the median of the numbers:
Order the data set from least to greatest.

The median is the average of the two central numbers for an even amount of numbers in the data set.

The answer is: 
Order the data set from least to greatest.
The median is the average of the two central numbers for an even amount of numbers in the data set.
The answer is:
Compare your answer with the correct one above
Determine the median of the following numbers: 
Determine the median of the following numbers:
Organize the numbers from least to greatest.

The median of an odd set of numbers is the central number.
The answer is: 
Organize the numbers from least to greatest.
The median of an odd set of numbers is the central number.
The answer is:
Compare your answer with the correct one above
Find the mode of the following data set:

Find the mode of the following data set:
Find the mode of the following data set:

The mode will be the most repeated number. To find it, simply see which number appears most.
In this case, we have two 67's, and only 1 of each other term.
Therefore, our mode is 67.
Find the mode of the following data set:
The mode will be the most repeated number. To find it, simply see which number appears most.
In this case, we have two 67's, and only 1 of each other term.
Therefore, our mode is 67.
Compare your answer with the correct one above
Determine the mode of the following numbers: 
Determine the mode of the following numbers:
The mode is defined as the number or numbers that has the highest frequency in the data set.
The numbers  appear in the data set twice, while the other numbers appear once.
This means that the mode is: 
The mode is defined as the number or numbers that has the highest frequency in the data set.
The numbers
This means that the mode is:
Compare your answer with the correct one above
Calculate the mode: 
Calculate the mode:
The definition of mode is the number or numbers that have the highest frequency in a data set.
There is only one of each number given in the data set.
This means that there is no mode.
The answer is: 
The definition of mode is the number or numbers that have the highest frequency in a data set.
There is only one of each number given in the data set.
This means that there is no mode.
The answer is:
Compare your answer with the correct one above
Determine the mode: 
Determine the mode:
The mode includes all numbers that have more than one frequency. Since every number only occurs once in the set of data, there is no mode.
The answer is: 
The mode includes all numbers that have more than one frequency. Since every number only occurs once in the set of data, there is no mode.
The answer is:
Compare your answer with the correct one above
Determine the mode of the numbers: 
Determine the mode of the numbers:
The mode includes all numbers that have the highest frequency.
The numbers three and six occur twice, while the other numbers appear once.
The answer is: 
The mode includes all numbers that have the highest frequency.
The numbers three and six occur twice, while the other numbers appear once.
The answer is:
Compare your answer with the correct one above

Refer to the above diagram. Maureen achieved a score of 603, which was the lowest score in the 601-700 range. Which of the following comes closest to being her percentile score?
Refer to the above diagram. Maureen achieved a score of 603, which was the lowest score in the 601-700 range. Which of the following comes closest to being her percentile score?
The histogram represents a total of
 scores.
Maureen's percentile is the percent of the scores that she outscored. Those scores were exactly the ones in the first four intervals shown - that is,
 out of the 120 scores, which was
 of the scores.
Percentile is given in whole numbers, so round this to 78.
The histogram represents a total of
Maureen's percentile is the percent of the scores that she outscored. Those scores were exactly the ones in the first four intervals shown - that is,
Percentile is given in whole numbers, so round this to 78.
Compare your answer with the correct one above
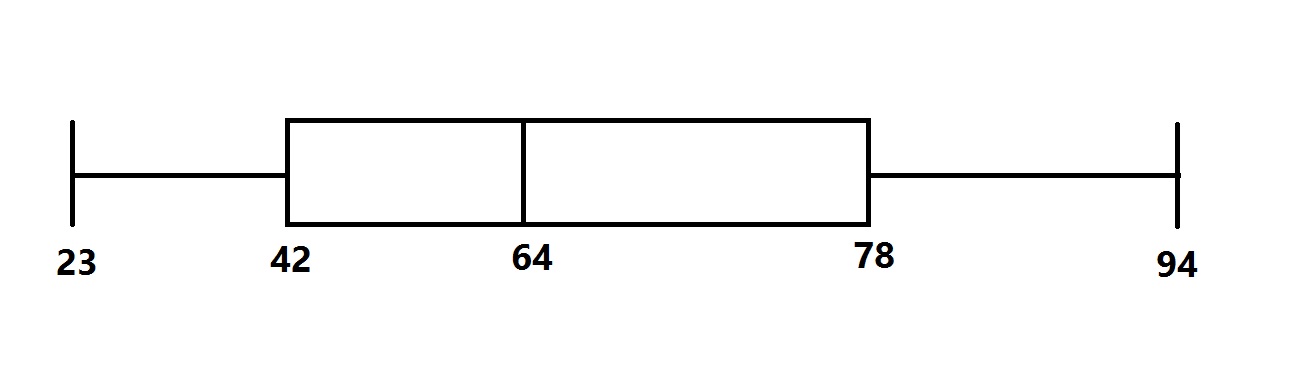
The distribution of scores for a test given to a large group of students is represented by the above box-and-whisker plot.
Which of the following questions cannot be answered from the diagram without looking for other information?
The distribution of scores for a test given to a large group of students is represented by the above box-and-whisker plot.
Which of the following questions cannot be answered from the diagram without looking for other information?
The midrange of the scores is the mean of the least and greatest scores, which are represented by the "whiskers" at either end:

The range of the scores is the difference of the least and greatest scores:

The median of the scores is represented by the vertical line within the box -

The interquartile range is the difference of the third and first quartiles, which are represented by the ends of the box:

Note that these scores all depend on the positions of the scores. The mean, however, depends on the scores themselves, which are not reflected in the diagram. The question cannot be answered from the box-and-whisker plot.
The midrange of the scores is the mean of the least and greatest scores, which are represented by the "whiskers" at either end:
The range of the scores is the difference of the least and greatest scores:
The median of the scores is represented by the vertical line within the box -
The interquartile range is the difference of the third and first quartiles, which are represented by the ends of the box:
Note that these scores all depend on the positions of the scores. The mean, however, depends on the scores themselves, which are not reflected in the diagram. The question cannot be answered from the box-and-whisker plot.
Compare your answer with the correct one above
Refer to the above diagram. Which of the following scores could possibly be at the eightieth percentile?
Refer to the above diagram. Which of the following scores could possibly be at the eightieth percentile?
The histogram represents a total of
 scores.
 , the 80th percentile, is the score that ranks above 80% of the scores, which, here, is
 scores.
This score would outrank the

scores in the first four ranges graphed, but not all of the

scores in the first five ranges.
This score must fall in the fifth range shown, which is the 601-700 range.
Therefore, the correct choice of the ones given is 620.
The histogram represents a total of
This score would outrank the
scores in the first four ranges graphed, but not all of the
scores in the first five ranges.
This score must fall in the fifth range shown, which is the 601-700 range.
Therefore, the correct choice of the ones given is 620.
Compare your answer with the correct one above