Standard Deviation
Practice Questions
SAT Subject Test in Math II › Standard Deviation
Questions
1
1
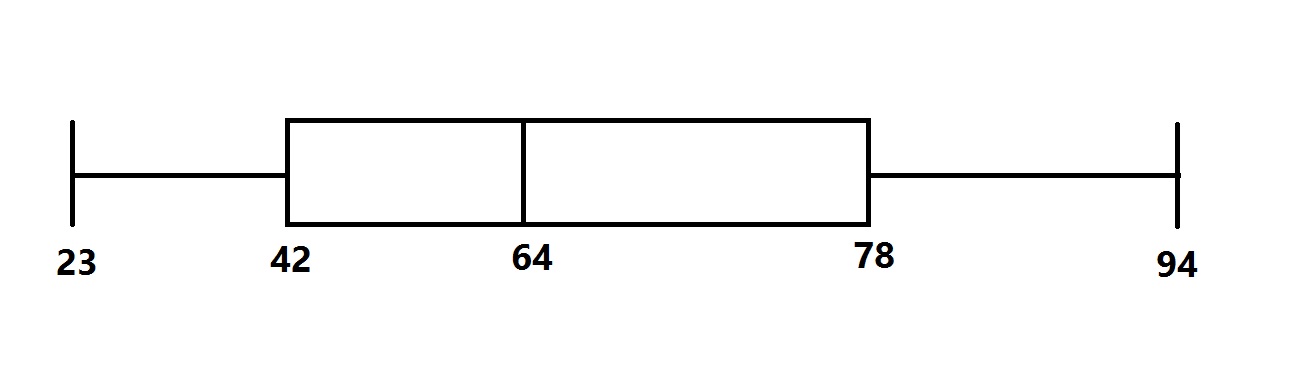
The distribution of scores for a test given to a large group of students is represented by the above box-and-whisker plot.
To the nearest whole number, what was the standard deviation of the scores?