Other Data Analyses
Practice Questions
SAT Subject Test in Math II › Other Data Analyses
Questions
3
1

Refer to the above diagram. Which of the following scores could possibly be at the eightieth percentile?
2
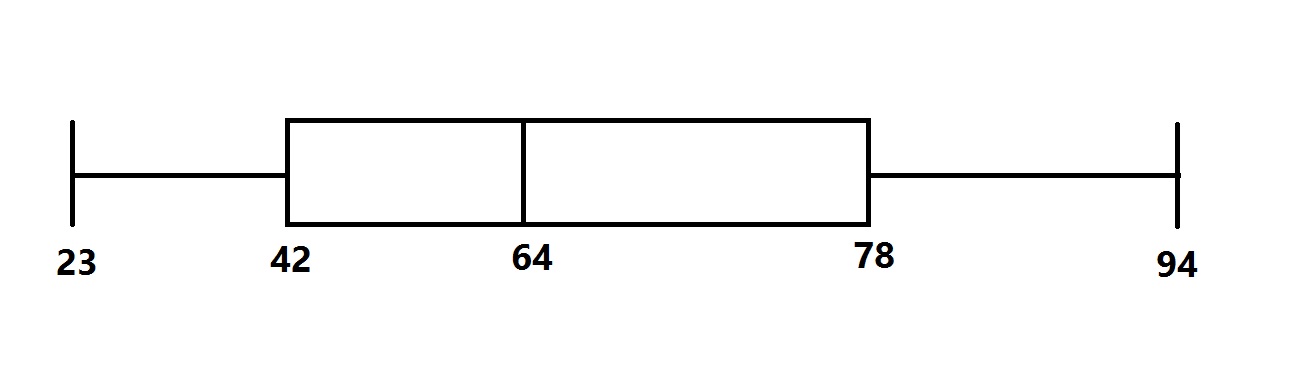
The distribution of scores for a test given to a large group of students is represented by the above box-and-whisker plot.
Which of the following questions cannot be answered from the diagram without looking for other information?
3
Refer to the above diagram. Maureen achieved a score of 603, which was the lowest score in the 601-700 range. Which of the following comes closest to being her percentile score?