Functions and Graphs - SAT Subject Test in Math I
Card 0 of 20
Determine where the graphs of the following equations will intersect.


Determine where the graphs of the following equations will intersect.
We can solve the system of equations using the substitution method.


Solve for  in the second equation.


Substitute this value of  into the first equation.
+2y=-1")
Now we can solve for  .
.


Solve for  using the first equation with this new value of
  .
.
=-1")


The solution is the ordered pair ") .
.
We can solve the system of equations using the substitution method.
Solve for
Substitute this value of
Now we can solve for
Solve for
The solution is the ordered pair
Compare your answer with the correct one above
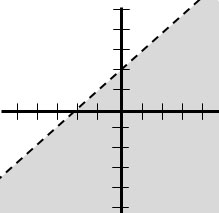
Which of the following graphs correctly depicts the graph of the inequality 
Which of the following graphs correctly depicts the graph of the inequality

Let's start by looking at the given equation:

The inequality is written in slope-intercept form; therefore, the slope is equal to  and the y-intercept is equal to
  .
.
All of the graphs depict a line with slope of  and y-intercept
  . Next, we need to decide if we should shade above or below the line. To do this, we can determine if the statement is true using the origin
 ") . If the origin satisfies the inequality, we will know to shade below the line. Substitute the values into the given equation and solve.
. If the origin satisfies the inequality, we will know to shade below the line. Substitute the values into the given equation and solve.


Because this statement is true, the origin must be included in the shaded region, so we shade below the line.
Finally, a statement that is "less than" or "greater than" requires a dashed line in the graph. On the other hand, those that are "greater than or equal to" or "less than or equal to" require a solid line. We will select the graph with shading below a dashed line.
Let's start by looking at the given equation:
The inequality is written in slope-intercept form; therefore, the slope is equal to
All of the graphs depict a line with slope of

Because this statement is true, the origin must be included in the shaded region, so we shade below the line.
Finally, a statement that is "less than" or "greater than" requires a dashed line in the graph. On the other hand, those that are "greater than or equal to" or "less than or equal to" require a solid line. We will select the graph with shading below a dashed line.
Compare your answer with the correct one above

Refer to the above diagram. which of the following compound inequality statements has this set of points as its graph?
Refer to the above diagram. which of the following compound inequality statements has this set of points as its graph?
A horizontal line has equation  for some value of
  ; since the line goes through a point with
  -coordinate 3, the line is
  . Also, since the line is solid and the region above this line is shaded in, the corresponding inequality is
  .
.
A vertical line has equation  for some value of
  ; since the line goes through a point with
  -coordinate 4, the line is
  . Also, since the line is solid and the region right of this line is shaded in, the corresponding inequality is
  .
.
Since only the region belonging to both sets is shaded - that is, their intersection is shaded - the statements are connected with "and". The correct choice is  .
.
A horizontal line has equation
A vertical line has equation
Since only the region belonging to both sets is shaded - that is, their intersection is shaded - the statements are connected with "and". The correct choice is
Compare your answer with the correct one above

Which of the following inequalities is graphed above?
Which of the following inequalities is graphed above?
First, we determine the equation of the boundary line. This line includes points ") and
and ") , so the slope can be calculated as follows:
, so the slope can be calculated as follows:

Since we also know the  -intercept is
 ") , we can substitute
, we can substitute  in the slope-intercept form to obtain the equation of the boundary line:


The boundary is included, as is indicated by the line being solid, so the equality symbol is replaced by either  or
or  . To find out which one, we can test a point in the solution set - for ease, we will choose
 ") :
:
 _____
_____ 
 _____
_____ 
 _____
_____ 
0 is less than 3 so the correct symbol is  .
.
The inequality is  .
.
First, we determine the equation of the boundary line. This line includes points
Since we also know the
The boundary is included, as is indicated by the line being solid, so the equality symbol is replaced by either
0 is less than 3 so the correct symbol is
The inequality is
Compare your answer with the correct one above
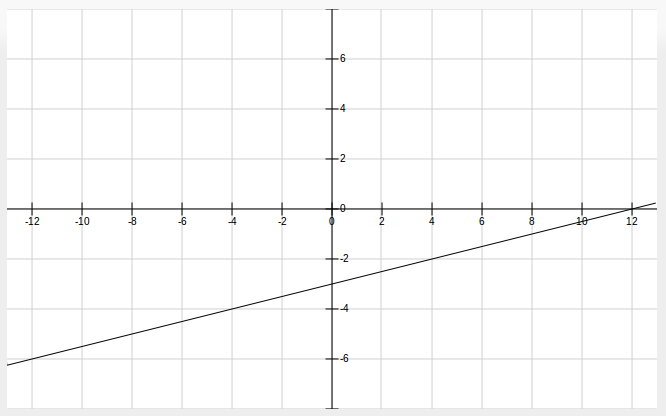
Which equation best matches the graph of the line shown above?
Which equation best matches the graph of the line shown above?
To find an equation of a line, we will always need to know the slope of that line -- and to find the slope, we need at least two points. It looks like we have (0, -3) and (12,0), which we'll call point 1 and point 2, respectively.
}{12-0}=\frac{3}{12}=\frac{1}{4}")
Now we need to plug in a point on the line into an equation for a line. We can use either slope-intercept form or point-slope form, but since the answer choices are in point-slope form, let's use that.
")
")
Unfortunately, that's not one of the answer choices. That's because we didn't pick the same point to substitute into our equation as the answer choices did. But we can see if any of the answer choices are equivalent to what we found. Our equation is equal to:

which is the slope-intercept form of the line. We have to put all the other answer choices into slope-intercept to see if they match. The only one that works is this one:
")
-2")


To find an equation of a line, we will always need to know the slope of that line -- and to find the slope, we need at least two points. It looks like we have (0, -3) and (12,0), which we'll call point 1 and point 2, respectively.
Now we need to plug in a point on the line into an equation for a line. We can use either slope-intercept form or point-slope form, but since the answer choices are in point-slope form, let's use that.
Unfortunately, that's not one of the answer choices. That's because we didn't pick the same point to substitute into our equation as the answer choices did. But we can see if any of the answer choices are equivalent to what we found. Our equation is equal to:
which is the slope-intercept form of the line. We have to put all the other answer choices into slope-intercept to see if they match. The only one that works is this one:
Compare your answer with the correct one above
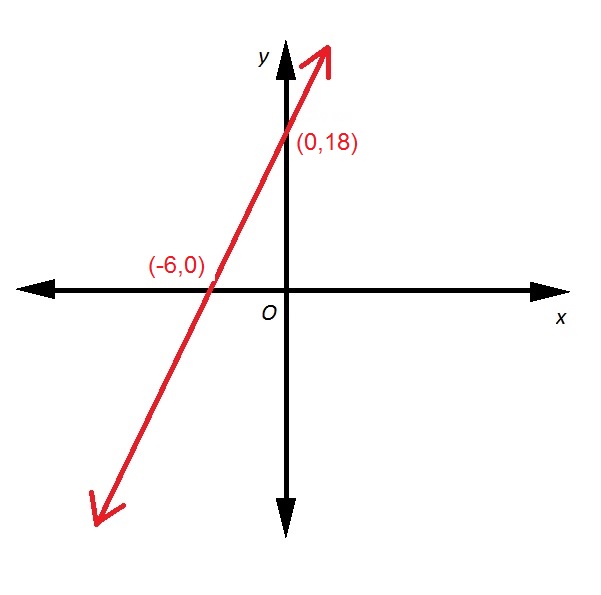
Refer to the above diagram. If the red line passes through the point ") , what is the value of
, what is the value of  ?
?
Refer to the above diagram. If the red line passes through the point
One way to answer this is to first find the equation of the line.
The slope of a line. given two points , (x_{2}, y_{2})") can be calculated using the slope formula
can be calculated using the slope formula

Set  :
:
} = \frac{18}{6} = 3")
The line has slope 3 and  -intercept
 ") , so we can substitute
, so we can substitute  in the slope-intercept form:


Now substitute 4 for  and
and  for
for  and solve for
  :
:


One way to answer this is to first find the equation of the line.
The slope of a line. given two points
Set
The line has slope 3 and
Now substitute 4 for
Compare your answer with the correct one above
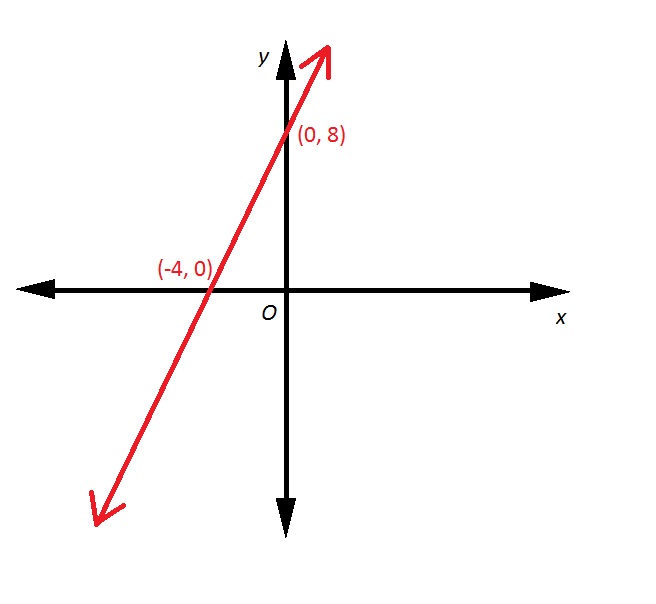
Refer to the above red line. A line is drawn perpendicular to that line, and with the same  -intercept. Give the equation of that line in slope-intercept form.
Refer to the above red line. A line is drawn perpendicular to that line, and with the same
First, we need to find the slope of the above line.
The slope of a line. given two points , (x_{2}, y_{2})") can be calculated using the slope formula
can be calculated using the slope formula

Set  :
:
} = \frac{8}{4} = 2")
The slope of a line perpendicular to it has as its slope the opposite of the reciprocal of 2, which would be  . Since we want this line to have the same
  -intercept as the first line, which is the point
 ") , we can substitute
, we can substitute  and
and  in the slope-intercept form:


First, we need to find the slope of the above line.
The slope of a line. given two points
Set
The slope of a line perpendicular to it has as its slope the opposite of the reciprocal of 2, which would be
Compare your answer with the correct one above

Refer to the line in the above diagram. It we were to continue to draw it so that it intersects the  -axis, where would its
  -intercept be?
Refer to the line in the above diagram. It we were to continue to draw it so that it intersects the
First, we need to find the slope of the line.
In order to move from the lower left point to the upper right point, it is necessary to move up five units and right three units. This is a rise of 5 and a run of 3. makes the slope of the line shown  .
.
We can use this to find the  -intercept
 ") using the slope formula as follows:
using the slope formula as follows:
The lower left point has coordinates ") . Therefore, we can set up and solve for
. Therefore, we can set up and solve for  in this slope formula, setting
  :
:


= \frac{5}{3}\cdot (-2)")


First, we need to find the slope of the line.
In order to move from the lower left point to the upper right point, it is necessary to move up five units and right three units. This is a rise of 5 and a run of 3. makes the slope of the line shown
We can use this to find the
The lower left point has coordinates
Compare your answer with the correct one above
Line  includes the points
 ") and
and ") . Line
. Line  includes the points
 ") and
and ") . Which of the following statements is true of these lines?
. Which of the following statements is true of these lines?
Line
We calculate the slopes of the lines using the slope formula.
The slope of line  is
is
} = \frac{0}{10} =0")
The slope of line  is
is
}{8 - 5} = \frac{0}{3} =0")
The lines have the same slope, making them either parallel or identical.
Since the slope of each line is 0, both lines are horizontal, and the equation of each takes the form  , where
  is the
  -coordinate of each point on the line. Therefore, line
  and line
  have equations
  and
and  .This makes them parallel lines.
We calculate the slopes of the lines using the slope formula.
The slope of line
The slope of line
The lines have the same slope, making them either parallel or identical.
Since the slope of each line is 0, both lines are horizontal, and the equation of each takes the form
Compare your answer with the correct one above
An individual's maximum heart rate can be found by subtracting his or her age from  . Which graph correctly expresses this relationship between years of age and maximum heart rate?
An individual's maximum heart rate can be found by subtracting his or her age from
In  form, where y = maximum heart rate and x = age, we can express the relationship as:

We are looking for a graph with a slope of -1 and a y-intercept of 220.
The slope is -1 because as you grow one year older, your maximum heart rate decreases by 1.
In
We are looking for a graph with a slope of -1 and a y-intercept of 220.
The slope is -1 because as you grow one year older, your maximum heart rate decreases by 1.
Compare your answer with the correct one above
Select the equation of the line perpendicular to the graph of  .
.
Select the equation of the line perpendicular to the graph of
Lines are perpendicular when their slopes are the negative recicprocals of each other such as  . To find the slope of our equation we must change it to slope y-intercept form.

Subtract the x variable from both sides:

Divide by 4 to isolate y:

The negative reciprocal of the above slope:  . The only equation with this slope is
  .
.
Lines are perpendicular when their slopes are the negative recicprocals of each other such as
Subtract the x variable from both sides:
Divide by 4 to isolate y:
The negative reciprocal of the above slope:
Compare your answer with the correct one above
Which equation best represents the following graph?
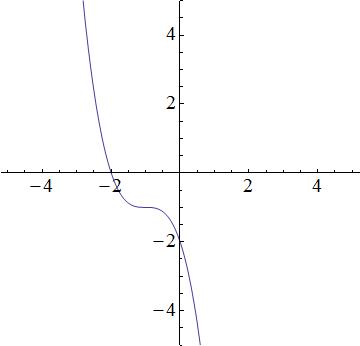
Which equation best represents the following graph?
We have the following answer choices.
=-(x + 1)^3 - 1")
=-(x + 1)^2 - 1")
=-x - 1")
=e^{2x-1}+\frac{1}{9}")
The first equation is a cubic function, which produces a function similar to the graph. The second equation is quadratic and thus, a parabola. The graph does not look like a prabola, so the 2nd equation will be incorrect. The third equation describes a line, but the graph is not linear; the third equation is incorrect. The fourth equation is incorrect because it is an exponential, and the graph is not an exponential. So that leaves the first equation as the best possible choice.
We have the following answer choices.
The first equation is a cubic function, which produces a function similar to the graph. The second equation is quadratic and thus, a parabola. The graph does not look like a prabola, so the 2nd equation will be incorrect. The third equation describes a line, but the graph is not linear; the third equation is incorrect. The fourth equation is incorrect because it is an exponential, and the graph is not an exponential. So that leaves the first equation as the best possible choice.
Compare your answer with the correct one above
Which of the graphs best represents the following function?
=\frac{9}{10}x^2-7x+2")
Which of the graphs best represents the following function?
=\frac{9}{10}x^2-7x+2")
The highest exponent of the variable term is two ( ). This tells that this function is quadratic, meaning that it is a parabola.
The graph below will be the answer, as it shows a parabolic curve.
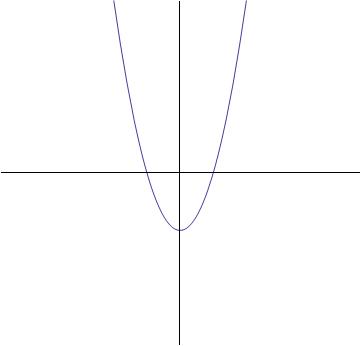
The highest exponent of the variable term is two (
The graph below will be the answer, as it shows a parabolic curve.
Compare your answer with the correct one above
=5x^{5}-3x^{2}+7")
Where does ") cross the
cross the  axis?
axis?
Where does
") crosses the
crosses the  axis when
  equals 0. So, substitute in 0 for
  :
:
=5x^{5}-3x^{2}+7")
=5(0)^{5}-3(0)^{2}+7")
=7")
Compare your answer with the correct one above
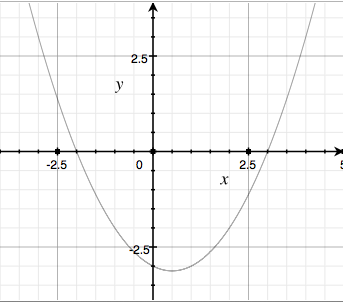
Which of the following is an equation for the above parabola?
Which of the following is an equation for the above parabola?
The zeros of the parabola are at  and
and  , so when placed into the formula
(x-z_{2})") ,
,
each of their signs is reversed to end up with the correct sign in the answer. The coefficient can be found by plugging in any easily-identifiable, non-zero point to the above formula. For example, we can plug in ") which gives
which gives
(4+2)")


The zeros of the parabola are at
each of their signs is reversed to end up with the correct sign in the answer. The coefficient can be found by plugging in any easily-identifiable, non-zero point to the above formula. For example, we can plug in
Compare your answer with the correct one above
Simplify the following expression:

Simplify the following expression:

To simplify, we must first simplify the absolute values.

Now, combine like terms:

To simplify, we must first simplify the absolute values.
Now, combine like terms:
Compare your answer with the correct one above
Which of the following is a graph for the following equation:

Which of the following is a graph for the following equation:
The way to figure out this problem is by understanding behavior of polynomials.
The sign that occurs before the  is positive and therefore it is understood that the function will open upwards. the "8" on the function is an even number which means that the function is going to be u-shaped. The only answer choice that fits both these criteria is:
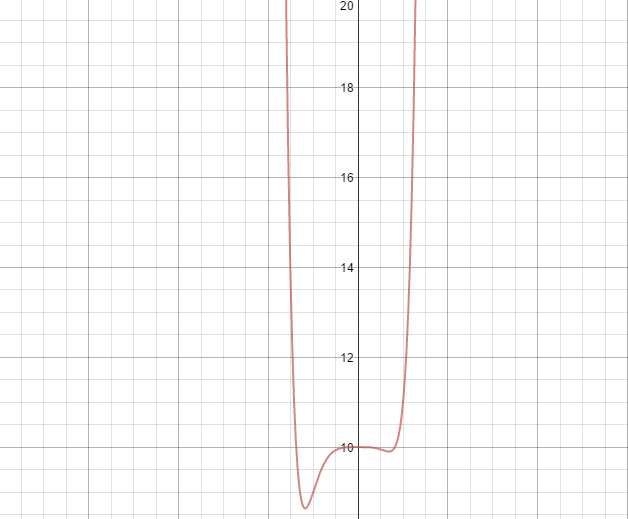
The way to figure out this problem is by understanding behavior of polynomials.
The sign that occurs before the
Compare your answer with the correct one above
Define a function  = x^{5}+ 4x^{2}") .
.
 = 7") for exactly one real value of
for exactly one real value of  on the interval
 ") .
.
Which of the following statements is correct about  ?
?
Define a function
Which of the following statements is correct about
Define = f(x) - 7 = x^{5}+ 4x^{2} -7") . Then, if
. Then, if = f(c) - 7 = 0") , it follows that
, it follows that  = 7") .
.
By the Intermediate Value Theorem (IVT), if ") is a continuous function, and
is a continuous function, and ") and
and ") are of unlike sign, then
are of unlike sign, then  = 0") for some
for some ") . As a polynomial,
. As a polynomial, ") is a continuous function, so the IVT applies here.
is a continuous function, so the IVT applies here.
Evaluate ") for each of the following values:
for each of the following values: 
 = 1.0^{5}+ 4 \cdot 1.0^{2} -7 = -2")
 = 1.1^{5}+ 4 \cdot 1.1^{2} -7 \approx -0.55")
 = 1.2^{5}+ 4 \cdot 1.2^{2} -7 \approx 1.24")
 = 1.3^{5}+ 4 \cdot 1.3^{2} -7 \approx 3.47")
 = 1.4^{5}+ 4 \cdot 1.4^{2} -7 \approx 6.22")
 = 1.5^{5}+ 4 \cdot 1.5^{2} -7 \approx 9.59")
Only in the case of ") does it hold that
does it hold that ") assumes a different sign at both endpoints -
assumes a different sign at both endpoints -  < 0 < g(1.2)") . By the IVT,
. By the IVT,  = 0") , and
, and  = 7") , for some
, for some ") .
.
Define
By the Intermediate Value Theorem (IVT), if
Evaluate
Only in the case of
Compare your answer with the correct one above
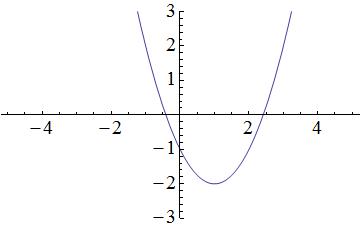
Which of the following graphs matches the function ^2-2") ?
?
Which of the following graphs matches the function
Start by visualizing the graph associated with the function  :
:
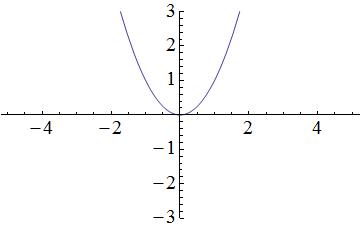
Terms within the parentheses associated with the squared x-variable will shift the parabola horizontally, while terms outside of the parentheses will shift the parabola vertically. In the provided equation, 2 is located outside of the parentheses and is subtracted from the terms located within the parentheses; therefore, the parabola in the graph will shift down by 2 units. A simplified graph of  looks like this:
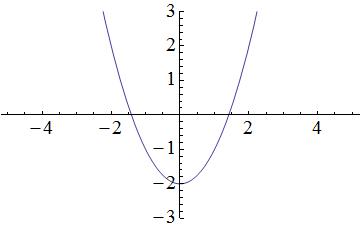
Remember that there is also a term within the parentheses. Within the parentheses, 1 is subtracted from the x-variable; thus, the parabola in the graph will shift to the right by 1 unit. As a result, the following graph matches the given function ^2-2") :
:
Start by visualizing the graph associated with the function
Terms within the parentheses associated with the squared x-variable will shift the parabola horizontally, while terms outside of the parentheses will shift the parabola vertically. In the provided equation, 2 is located outside of the parentheses and is subtracted from the terms located within the parentheses; therefore, the parabola in the graph will shift down by 2 units. A simplified graph of
Remember that there is also a term within the parentheses. Within the parentheses, 1 is subtracted from the x-variable; thus, the parabola in the graph will shift to the right by 1 unit. As a result, the following graph matches the given function
Compare your answer with the correct one above
Find the vertex form of the following quadratic equation:

Find the vertex form of the following quadratic equation:
Factor 2 as GCF from the first two terms giving us:
 -1")
Now we complete the square by adding 4 to the expression inside the parenthesis and subtracting 8 ( because  ) resulting in the following equation:
 - 1 - 8")
which is equal to
^{2} \right ) - 9")
Hence the vertex is located at
")
Factor 2 as GCF from the first two terms giving us:
Now we complete the square by adding 4 to the expression inside the parenthesis and subtracting 8 ( because
which is equal to
Hence the vertex is located at
Compare your answer with the correct one above