Graphing Other Functions
Practice Questions
SAT Subject Test in Math I › Graphing Other Functions
Questions
7
1
Which of the graphs best represents the following function?
=\frac{9}{10}x^2-7x+2")
2
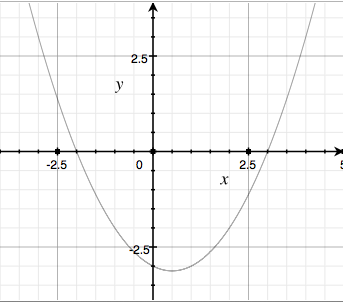
Which of the following is an equation for the above parabola?
3
Which of the following is a graph for the following equation:

4
Simplify the following expression:

5
Define a function  = x^{5}+ 4x^{2}")
 = 7")

")
Which of the following statements is correct about 
6
=5x^{5}-3x^{2}+7")
Where does ")

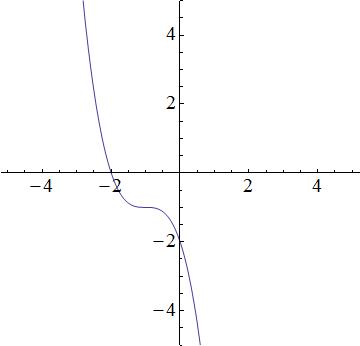
7
Which equation best represents the following graph?