Graphing Linear Functions
Practice Questions
SAT Subject Test in Math I › Graphing Linear Functions
Determine where the graphs of the following equations will intersect.


Which of the following inequalities is graphed above?
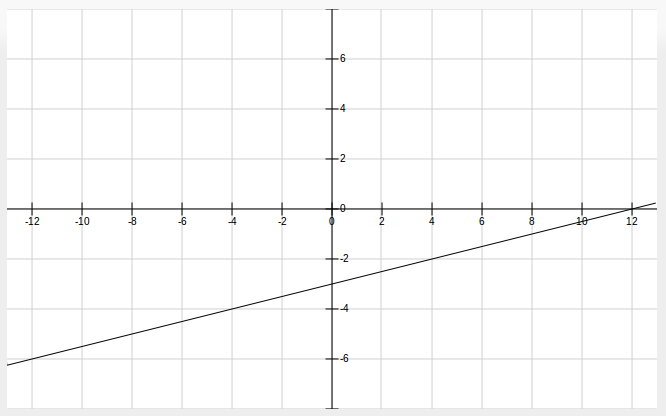
Which equation best matches the graph of the line shown above?
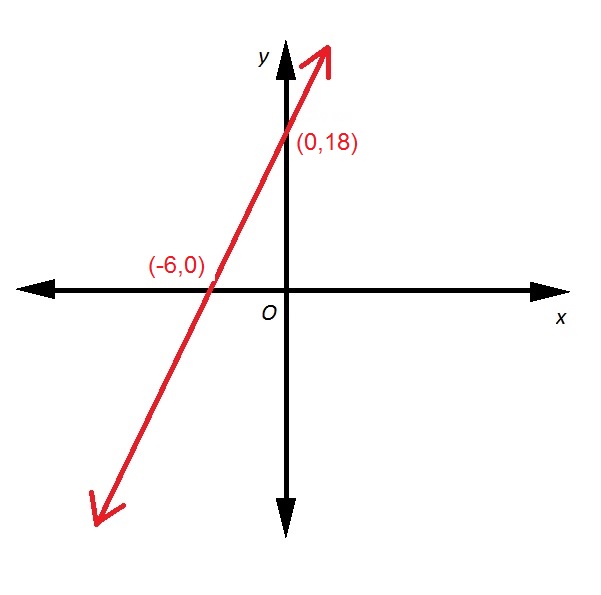
Refer to the above diagram. If the red line passes through the point ")

An individual's maximum heart rate can be found by subtracting his or her age from 

Refer to the line in the above diagram. It we were to continue to draw it so that it intersects the 

Select the equation of the line perpendicular to the graph of 
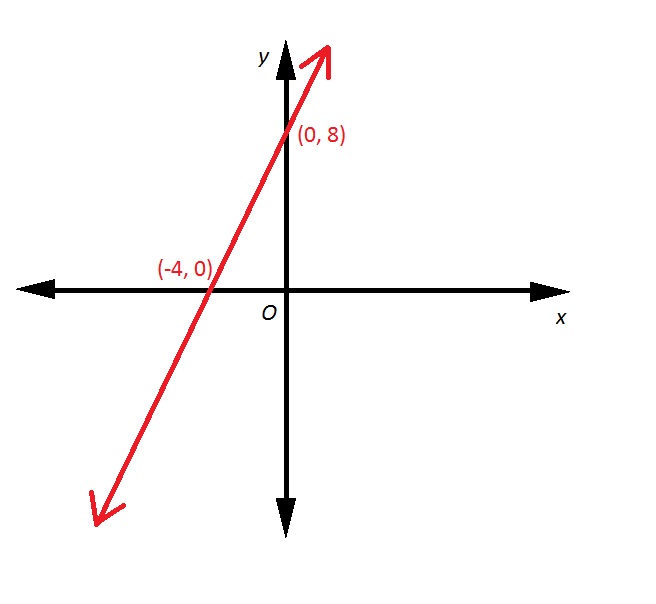
Refer to the above red line. A line is drawn perpendicular to that line, and with the same 
Line 
")
")

")
")
Which of the following graphs correctly depicts the graph of the inequality
