Data Analysis and Statistics
Practice Questions
SAT Subject Test in Math I › Data Analysis and Statistics
A penny is altered so that the odds are 3 to 2 against it coming up tails when tossed; a nickel is altered so that the odds are 4 to 3 against it coming up tails when tossed. If both coins are tossed; what are the odds of both coins coming up heads?
A penny is altered so that the odds are 3 to 2 against it coming up tails when tossed; a nickel is altered so that the odds are 4 to 3 against it coming up tails when tossed. If both coins are tossed; what are the odds of both coins coming up heads?
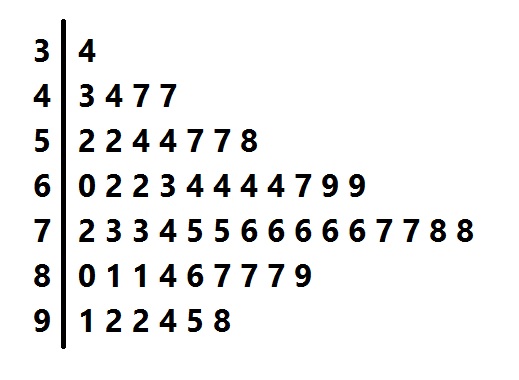
Above is the stem-and-leaf display for a group of test scores. Which of the following scores would come closest to being at the 70th percentile?
Above is the stem-and-leaf display for a group of test scores. Which of the following scores would come closest to being at the 70th percentile?
What is the mean of: 
What is the mean of:
Determine the interquartile range of the following numbers:
42, 51, 62, 47, 38, 50, 54, 43
Determine the interquartile range of the following numbers:
42, 51, 62, 47, 38, 50, 54, 43
The interquartile range is the difference in value between the upper quartile and lower quartile.
Find the interquartile range of the following data set:

The interquartile range is the difference in value between the upper quartile and lower quartile.
Find the interquartile range of the following data set: