Data Analysis - PSAT Math
Card 0 of 20
A teacher at a high school conducted a survey of seniors and found that  students owned a laptop and
  of those students also had a car. There were
  students that did not have a laptop, but owned a car. Last, they found that
  students did not own a laptop nor a car. Given this information, how many students had a laptop, but did not own a car?
A teacher at a high school conducted a survey of seniors and found that
To help answer this question, we can construct a two-way table and fill in our known quantities from the question.
The columns of the table will represent the students who have a laptop or do not have a laptop and the rows will contain the students who have a car or do not have a car. The first bit of information that we were given from the question was that  students had a laptop; therefore,
  needs to go in the "laptop" column as the row total. Next, we were told that of those students,
  owned a car; therefore, we need to put
  in the "laptop" column and in the "car" row. Then, we were told that
  students do not own a laptop, but own a car, so we need to put
  in the "no laptop" column and the "car" row. Finally, we were told that
  students do not have a laptop or a car, so
  needs to go in the "no laptop" column and "no car" row. If done correctly, you should create a table similar to the following:

Our question asked how many students have a laptop, but do not own have a car. We can take the total number of students that own a lap top,  , and subtract the number of students who have a car,

This means that  students who have a laptop, don't have a car.
To help answer this question, we can construct a two-way table and fill in our known quantities from the question.
The columns of the table will represent the students who have a laptop or do not have a laptop and the rows will contain the students who have a car or do not have a car. The first bit of information that we were given from the question was that
Our question asked how many students have a laptop, but do not own have a car. We can take the total number of students that own a lap top,
This means that
Compare your answer with the correct one above
A teacher at a high school conducted a survey of seniors and found that students owned a laptop and of those students also had a car. There were students that did not have a laptop, but owned a car. Last, they found that students did not own a laptop nor a car. Given this information, how many students do not have a laptop?
A teacher at a high school conducted a survey of seniors and found that
To help answer this question, we can construct a two-way table and fill in our known quantities from the question.
The columns of the table will represent the students who have a laptop or do not have a laptop and the rows will contain the students who have a car or do not have a car. The first bit of information that we were given from the question was that students had a laptop; therefore, needs to go in the "laptop" column as the row total. Next, we were told that of those students, owned a car; therefore, we need to put in the "laptop" column and in the "car" row. Then, we were told that students do not own a laptop, but own a car, so we need to put in the "no laptop" column and the "car" row. Finally, we were told that students do not have a laptop or a car, so needs to go in the "no laptop" column and "no car" row. If done correctly, you should create a table similar to the following:
Our question asked how many students do not have a laptop. We add up the numbers in the "no laptop" column to get the total:

This means that  students do not have a laptop.
To help answer this question, we can construct a two-way table and fill in our known quantities from the question.
The columns of the table will represent the students who have a laptop or do not have a laptop and the rows will contain the students who have a car or do not have a car. The first bit of information that we were given from the question was that
Our question asked how many students do not have a laptop. We add up the numbers in the "no laptop" column to get the total:
This means that
Compare your answer with the correct one above
A teacher at a high school conducted a survey of seniors and found that students owned a laptop and of those students also had a car. There were students that did not have a laptop, but owned a car. Last, they found that students did not own a laptop nor a car. Given this information, how many students have a car?
A teacher at a high school conducted a survey of seniors and found that
To help answer this question, we can construct a two-way table and fill in our known quantities from the question.
The columns of the table will represent the students who have a laptop or do not have a laptop and the rows will contain the students who have a car or do not have a car. The first bit of information that we were given from the question was that students had a laptop; therefore, needs to go in the "laptop" column as the row total. Next, we were told that of those students, owned a car; therefore, we need to put in the "laptop" column and in the "car" row. Then, we were told that students do not own a laptop, but own a car, so we need to put in the "no laptop" column and the "car" row. Finally, we were told that students do not have a laptop or a car, so needs to go in the "no laptop" column and "no car" row. If done correctly, you should create a table similar to the following:
Our question asked how many students have a car. We add up the numbers in the "car" row to get the total:

This means that  students have a car.
To help answer this question, we can construct a two-way table and fill in our known quantities from the question.
The columns of the table will represent the students who have a laptop or do not have a laptop and the rows will contain the students who have a car or do not have a car. The first bit of information that we were given from the question was that
Our question asked how many students have a car. We add up the numbers in the "car" row to get the total:
This means that
Compare your answer with the correct one above
A teacher at a high school conducted a survey of seniors and found that students owned a laptop and of those students also had a car. There were students that did not have a laptop, but owned a car. Last, they found that students did not own a laptop nor a car. Given this information, how many students do not have a car?
A teacher at a high school conducted a survey of seniors and found that
To help answer this question, we can construct a two-way table and fill in our known quantities from the question.
The columns of the table will represent the students who have a laptop or do not have a laptop and the rows will contain the students who have a car or do not have a car. The first bit of information that we were given from the question was that students had a laptop; therefore, needs to go in the "laptop" column as the row total. Next, we were told that of those students, owned a car; therefore, we need to put in the "laptop" column and in the "car" row. Then, we were told that students do not own a laptop, but own a car, so we need to put in the "no laptop" column and the "car" row. Finally, we were told that students do not have a laptop or a car, so needs to go in the "no laptop" column and "no car" row. If done correctly, you should create a table similar to the following:
Our question asked how many students do not have a car. We add up the numbers in the "no car" row to get the total, but first we need to fill in a gap in our table, students who have a laptop, but don't have a car:
We can take the total number of students that own a lap top, , and subtract the number of students who have a car,
This means that students who have a laptop, don't have a car.
Now, we add up the numbers in the "no car" row to get the total:

This means that  students do not have a car.
To help answer this question, we can construct a two-way table and fill in our known quantities from the question.
The columns of the table will represent the students who have a laptop or do not have a laptop and the rows will contain the students who have a car or do not have a car. The first bit of information that we were given from the question was that
Our question asked how many students do not have a car. We add up the numbers in the "no car" row to get the total, but first we need to fill in a gap in our table, students who have a laptop, but don't have a car:
We can take the total number of students that own a lap top,
This means that
Now, we add up the numbers in the "no car" row to get the total:
This means that
Compare your answer with the correct one above
A teacher at a high school conducted a survey of freshman and found that  students had a curfew and
  of those students were also honor roll students. There were
  students that did not have a curfew, but were on honor roll. Last, they found that
  students did not have a curfew nor were on honor roll. Given this information, how many students had a curfew, but were not on honor roll?
A teacher at a high school conducted a survey of freshman and found that
To help answer this question, we can construct a two-way table and fill in our known quantities from the question.
The columns of the table will represent the students who have a curfew or do not have a curfew and the rows will contain the students who are on honor roll or are not on honor roll. The first bit of information that we were given from the question was that  students had a curfew; therefore,
  needs to go in the "curfew" column as the row total. Next, we were told that of those students,
  were on honor roll; therefore, we need to put
  in the "curfew" column and in the "honor roll" row. Then, we were told that
  students do not have a curfew, but were on honor roll, so we need to put
  in the "no curfew" column and the "honor roll" row. Finally, we were told that
  students do not have a curfew or were on honor roll, so
  needs to go in the "no curfew" column and "no honor roll" row. If done correctly, you should create a table similar to the following:
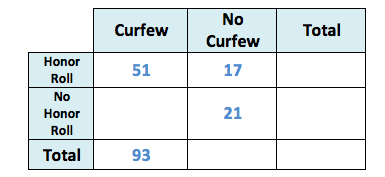
Our question asked how many students have a curfew, but were not on honor roll. We can take the total number of students that have a curfew,  , and subtract the number of students who are on honor roll,

This means that  students who have a curfew, aren't on honor roll.
To help answer this question, we can construct a two-way table and fill in our known quantities from the question.
The columns of the table will represent the students who have a curfew or do not have a curfew and the rows will contain the students who are on honor roll or are not on honor roll. The first bit of information that we were given from the question was that
Our question asked how many students have a curfew, but were not on honor roll. We can take the total number of students that have a curfew,
This means that
Compare your answer with the correct one above
A teacher at a high school conducted a survey of freshman and found that  students had a curfew and
  of those students were also honor roll students. There were
  students that did not have a curfew, but were on honor roll. Last, they found that
  students did not have a curfew nor were on honor roll. Given this information, how many students do not have a curfew?
A teacher at a high school conducted a survey of freshman and found that
To help answer this question, we can construct a two-way table and fill in our known quantities from the question.
The columns of the table will represent the students who have a curfew or do not have a curfew and the rows will contain the students who are on honor roll or are not on honor roll. The first bit of information that we were given from the question was that  students had a curfew; therefore,
  needs to go in the "curfew" column as the row total. Next, we were told that of those students,
  were on honor roll; therefore, we need to put
  in the "curfew" column and in the "honor roll" row. Then, we were told that
  students do not have a curfew, but were on honor roll, so we need to put
  in the "no curfew" column and the "honor roll" row. Finally, we were told that
  students do not have a curfew or were on honor roll, so
  needs to go in the "no curfew" column and "no honor roll" row. If done correctly, you should create a table similar to the following:
Our question asked how many students did not have a curfew. We add up the numbers in the "no curfew" column to get the total:

This means that  students do not have a curfew.
To help answer this question, we can construct a two-way table and fill in our known quantities from the question.
The columns of the table will represent the students who have a curfew or do not have a curfew and the rows will contain the students who are on honor roll or are not on honor roll. The first bit of information that we were given from the question was that
Our question asked how many students did not have a curfew. We add up the numbers in the "no curfew" column to get the total:
This means that
Compare your answer with the correct one above
A teacher at a high school conducted a survey of freshman and found that  students had a curfew and
  of those students were also honor roll students. There were
  students that did not have a curfew, but were on honor roll. Last, they found that
  students did not have a curfew nor were on honor roll. Given this information, how many students were on honor roll?
A teacher at a high school conducted a survey of freshman and found that
To help answer this question, we can construct a two-way table and fill in our known quantities from the question.
The columns of the table will represent the students who have a curfew or do not have a curfew and the rows will contain the students who are on honor roll or are not on honor roll. The first bit of information that we were given from the question was that  students had a curfew; therefore,
  needs to go in the "curfew" column as the row total. Next, we were told that of those students,
  were on honor roll; therefore, we need to put
  in the "curfew" column and in the "honor roll" row. Then, we were told that
  students do not have a curfew, but were on honor roll, so we need to put
  in the "no curfew" column and the "honor roll" row. Finally, we were told that
  students do not have a curfew or were on honor roll, so
  needs to go in the "no curfew" column and "no honor roll" row. If done correctly, you should create a table similar to the following:
Our question asked how many students were on honor roll. We add up the numbers in the "honor roll" row to get the total:

This means that  students were on honor roll.
To help answer this question, we can construct a two-way table and fill in our known quantities from the question.
The columns of the table will represent the students who have a curfew or do not have a curfew and the rows will contain the students who are on honor roll or are not on honor roll. The first bit of information that we were given from the question was that
Our question asked how many students were on honor roll. We add up the numbers in the "honor roll" row to get the total:
This means that
Compare your answer with the correct one above
A teacher at a high school conducted a survey of freshman and found that  students had a curfew and
  of those students were also honor roll students. There were
  students that did not have a curfew, but were on the honor roll. Last, they found that
  students did not have a curfew nor were on the honor roll. Given this information, how many students were not on the honor roll?
A teacher at a high school conducted a survey of freshman and found that
To help answer this question, we can construct a two-way table and fill in our known quantities from the question.
The columns of the table will represent the students who have a curfew or do not have a curfew and the rows will contain the students who are on honor roll or are not on honor roll. The first bit of information that we were given from the question was that  students had a curfew; therefore,
  needs to go in the "curfew" column as the row total. Next, we were told that of those students,
  were on honor roll; therefore, we need to put
  in the "curfew" column and in the "honor roll" row. Then, we were told that
  students do not have a curfew, but were on honor roll, so we need to put
  in the "no curfew" column and the "honor roll" row. Finally, we were told that
  students do not have a curfew or were on honor roll, so
  needs to go in the "no curfew" column and "no honor roll" row. If done correctly, you should create a table similar to the following:
Our question asked how many students were not on honor roll. We add up the numbers in the "no honor roll" row to get the total, but first we need to fill in a gap in our table, students who have a curfew, but were not on honor roll. We can take the total number of students that have a curfew,  , and subtract the number of students who are on honor roll,

This means that  students who have a curfew, aren't on honor roll.
Now, we add up the numbers in the "no honor roll" row to get the total:

This means that  students were not on honor roll.
To help answer this question, we can construct a two-way table and fill in our known quantities from the question.
The columns of the table will represent the students who have a curfew or do not have a curfew and the rows will contain the students who are on honor roll or are not on honor roll. The first bit of information that we were given from the question was that
Our question asked how many students were not on honor roll. We add up the numbers in the "no honor roll" row to get the total, but first we need to fill in a gap in our table, students who have a curfew, but were not on honor roll. We can take the total number of students that have a curfew,
This means that
Now, we add up the numbers in the "no honor roll" row to get the total:
This means that
Compare your answer with the correct one above
A middle school teacher conducted a survey of the  grade class and found that
  students were athletes and
  of those students drink soda. There were
  students that were not athletes, but drank soda. Last, they found that
  students did not have a curfew nor were on honor roll. Given this information, how many students were athletes, but didn't drink soda?
A middle school teacher conducted a survey of the
To help answer this question, we can construct a two-way table and fill in our known quantities from the question.
The columns of the table will represent the students who are athletes or are not athletes and the rows will contain the students who drink soda or do not drink soda. The first bit of information that we were given from the question was that  students were athletes; therefore,
  needs to go in the "athlete" column as the row total. Next, we were told that of those students,
  drinks soda; therefore, we need to put
  in the "athlete" column and in the "drinks soda" row. Then, we were told that
  students were not athletes, but drink soda, so we need to put
  in the "not an athlete" column and the "drinks soda" row. Finally, we were told that
  students are not athletes or soda drinkers, so
  needs to go in the "not an athlete" column and "doesn't drink soda" row. If done correctly, you should create a table similar to the following:
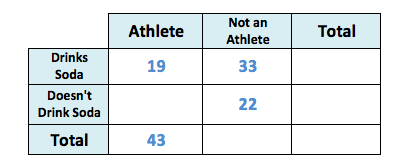
Our question asked how many students are athletes, but don't drink soda. We can take the total number of students who are athletes,  , and subtract the number of students who drink soda,

This means that  students who are athletes, don't drink soda.
To help answer this question, we can construct a two-way table and fill in our known quantities from the question.
The columns of the table will represent the students who are athletes or are not athletes and the rows will contain the students who drink soda or do not drink soda. The first bit of information that we were given from the question was that
Our question asked how many students are athletes, but don't drink soda. We can take the total number of students who are athletes,
This means that
Compare your answer with the correct one above
A middle school teacher conducted a survey of the  grade class and found that
  students were athletes and
  of those students drink soda. There were
  students that were not athletes, but drank soda. Last, they found that
  students neither drank soda nor were athletes. Given this information, how many students were not athletes?
A middle school teacher conducted a survey of the
To help answer this question, we can construct a two-way table and fill in our known quantities from the question.
The columns of the table will represent the students who are athletes or are not athletes and the rows will contain the students who drink soda or do not drink soda. The first bit of information that we were given from the question was that  students were athletes; therefore,
  needs to go in the "athlete" column as the row total. Next, we were told that of those students,
  drinks soda; therefore, we need to put
  in the "athlete" column and in the "drinks soda" row. Then, we were told that
  students were not athletes, but drink soda, so we need to put
  in the "not an athlete" column and the "drinks soda" row. Finally, we were told that
  students are not athletes or soda drinkers, so
  needs to go in the "not an athlete" column and "doesn't drink soda" row. If done correctly, you should create a table similar to the following:
Our question asked how many students were not athletes. We add up the numbers in the "not an athlete" column to get the total:

This means that  students were not athletes.
To help answer this question, we can construct a two-way table and fill in our known quantities from the question.
The columns of the table will represent the students who are athletes or are not athletes and the rows will contain the students who drink soda or do not drink soda. The first bit of information that we were given from the question was that
Our question asked how many students were not athletes. We add up the numbers in the "not an athlete" column to get the total:
This means that
Compare your answer with the correct one above
A middle school teacher conducted a survey of the  grade class and found that
  students were athletes and
  of those students drink soda. There were
  students that were not athletes, but drank soda. Last, they found that
  students did not have a curfew nor were on honor roll. Given this information, how many students drink soda?
A middle school teacher conducted a survey of the
To help answer this question, we can construct a two-way table and fill in our known quantities from the question.
The columns of the table will represent the students who are athletes or are not athletes and the rows will contain the students who drink soda or do not drink soda. The first bit of information that we were given from the question was that  students were athletes; therefore,
  needs to go in the "athlete" column as the row total. Next, we were told that of those students,
  drinks soda; therefore, we need to put
  in the "athlete" column and in the "drinks soda" row. Then, we were told that
  students were not athletes, but drink soda, so we need to put
  in the "not an athlete" column and the "drinks soda" row. Finally, we were told that
  students are not athletes or soda drinkers, so
  needs to go in the "not an athlete" column and "doesn't drink soda" row. If done correctly, you should create a table similar to the following:
Our question asked how many students drink soda. We add up the numbers in the "drinks soda" row to get the total:

This means that  students drink soda.
To help answer this question, we can construct a two-way table and fill in our known quantities from the question.
The columns of the table will represent the students who are athletes or are not athletes and the rows will contain the students who drink soda or do not drink soda. The first bit of information that we were given from the question was that
Our question asked how many students drink soda. We add up the numbers in the "drinks soda" row to get the total:
This means that
Compare your answer with the correct one above
A middle school teacher conducted a survey of the  grade class and found that
  students were athletes and
  of those students drink soda. There were
  students that were not athletes, but drank soda. Last, they found that
  students were neither athletes nor drank soda. Given this information, how many students don't drink soda?
A middle school teacher conducted a survey of the
To help answer this question, we can construct a two-way table and fill in our known quantities from the question.
The columns of the table will represent the students who are athletes or are not athletes and the rows will contain the students who drink soda or do not drink soda. The first bit of information that we were given from the question was that  students were athletes; therefore,
  needs to go in the "athlete" column as the row total. Next, we were told that of those students,
  drinks soda; therefore, we need to put
  in the "athlete" column and in the "drinks soda" row. Then, we were told that
  students were not athletes, but drink soda, so we need to put
  in the "not an athlete" column and the "drinks soda" row. Finally, we were told that
  students are not athletes or soda drinkers, so
  needs to go in the "not an athlete" column and "doesn't drink soda" row. If done correctly, you should create a table similar to the following:
Our question asked how many students don't drink soda. We add up the numbers in the "doesn't drink soda" row to get the total, but first we need to fill in a gap in our table, students who were athletes, but don't drink soda. We can take the total number of students who are athletes,  , and subtract the number of students who drink soda,

This means that  students who are athletes, don't drink soda.
Now, we add up the numbers in the "doesn't drink soda" row to get the total:

This means that  students don't drink soda.
To help answer this question, we can construct a two-way table and fill in our known quantities from the question.
The columns of the table will represent the students who are athletes or are not athletes and the rows will contain the students who drink soda or do not drink soda. The first bit of information that we were given from the question was that
Our question asked how many students don't drink soda. We add up the numbers in the "doesn't drink soda" row to get the total, but first we need to fill in a gap in our table, students who were athletes, but don't drink soda. We can take the total number of students who are athletes,
This means that
Now, we add up the numbers in the "doesn't drink soda" row to get the total:
This means that
Compare your answer with the correct one above
Mr. Miller conducted a statistical experiment to determine the relationship between final grades and the number of school days that his students missed. In this study, he assigned the number of missed school days as the independent variable, and the final grade was assigned as the dependent variable. Every student started the class with a  , and based on class assignments, tests scores, etc. the students' final grade was determined. Mr. Miller found that for every one day missed, the students' grade dropped by
  . Based on this data, select the equation of the best fit line for this scenario.
Mr. Miller conducted a statistical experiment to determine the relationship between final grades and the number of school days that his students missed. In this study, he assigned the number of missed school days as the independent variable, and the final grade was assigned as the dependent variable. Every student started the class with a
The equation of the best fit line will be in slope intercept form:

The question tells us that days are the independent variable, or  , and the dependent variable is the final class grade, or
Every students starts with a  . If we think about a graph, then the start of the graph is when
  is equal to zero, which is the
  ; thus, the
  value of the equation should be
The final piece that we need is the slope, or  value, which is associated with the number of days missed. Let's recall from the question that for every single day missed the students grade dropped by
  . "Drops" means that we are going to have a negative slope; thus, the slope for this scenario is the following:

If we put all of the pieces together, then the equation for the line of best fit is the following:

The equation of the best fit line will be in slope intercept form:
The question tells us that days are the independent variable, or
Every students starts with a
The final piece that we need is the slope, or

If we put all of the pieces together, then the equation for the line of best fit is the following:

Compare your answer with the correct one above
Matt conducted a statistical experiment to determine the relationship between yearly salary earned and age. In this study, he assigned age (in years) as the independent variable, and yearly salary as the dependent variable. He drew a line of best fit and found a slope of  . What does this mean?
Matt conducted a statistical experiment to determine the relationship between yearly salary earned and age. In this study, he assigned age (in years) as the independent variable, and yearly salary as the dependent variable. He drew a line of best fit and found a slope of
The slope of a line is the rate that a line increases or decreases. The question tells us that Matt looked at the relationship between age, in years; thus, the correct answer should include "each year", which eliminates the answer choices that include "each month". Finally the slope is  , which is a positive number; thus, the line increases by
  each year. This means that the correct answer is "Each year, a person's salary increases by
  ".
".
The slope of a line is the rate that a line increases or decreases. The question tells us that Matt looked at the relationship between age, in years; thus, the correct answer should include "each year", which eliminates the answer choices that include "each month". Finally the slope is
Compare your answer with the correct one above
Mrs. Frame conducted a statistical experiment to determine the relationship between test grades and the number of hours her students spent studying. In this study, she assigned the number of hours spent studying as the independent variable, and the test grades (in percentages) were assigned as the dependent variable. She plotted the data on a scatter plot and drew a line of best fit. If the slope of the best fit line was  and one of her data points was
 ") , can we determine the
, can we determine the  of the best fit line? If yes, determine the
  .
.
Mrs. Frame conducted a statistical experiment to determine the relationship between test grades and the number of hours her students spent studying. In this study, she assigned the number of hours spent studying as the independent variable, and the test grades (in percentages) were assigned as the dependent variable. She plotted the data on a scatter plot and drew a line of best fit. If the slope of the best fit line was
The equation of the best fit line will be in slope intercept form:
The question tells us that the slope is  and we are provided with a data point, so we can plug in the known values into the equation to solve for the
+b")

We had to convert our percentage into a decimal in order to multiple, but we need to change it back to a percent before we subtract so that we arrive at the correct answer because  is a percent based on the information from the question


 which means the y-intercept is
 ")
The equation of the best fit line will be in slope intercept form:
The question tells us that the slope is
We had to convert our percentage into a decimal in order to multiple, but we need to change it back to a percent before we subtract so that we arrive at the correct answer because
Compare your answer with the correct one above
A school principal conducted a statistical experiment to determine the relationship between  and the number of hours spent studying each week. In this study, the principal assigned the number of hours spent studying as the independent variable, and the
  was assigned as the dependent variable. The principal drew a line of best fit and found the
  to be
to be  . What does this mean?
A school principal conducted a statistical experiment to determine the relationship between
The question tells us that the hours spent per week studying is the independent variable, or the  , and the
  is the dependent variable, or the
The  is when
  ; thus, when a student spends zero hours studying their average
  is
is 
The question tells us that the hours spent per week studying is the independent variable, or the
The
Compare your answer with the correct one above
Mr. Miller conducted a statistical experiment to determine the relationship between final grades and the number of school days that his students missed. In this study, he assigned the number of missed school days as the independent variable, and the final grade was assigned as the dependent variable. He plotted his results on a scatter plot. If the results follow a linear relationship, what is a reasonable conclusion that could be found based these results?
Mr. Miller conducted a statistical experiment to determine the relationship between final grades and the number of school days that his students missed. In this study, he assigned the number of missed school days as the independent variable, and the final grade was assigned as the dependent variable. He plotted his results on a scatter plot. If the results follow a linear relationship, what is a reasonable conclusion that could be found based these results?
We know, from attending school ourselves, that every day we learn something new in school. When a day of school is missed, there is a lot of catch up that needs to be done, but the teacher's instructions and lesson given each day can't be repeated the day you return, because the teacher has to move on with the rest of the class. If you missed a week of school, that's five days of lessons that were missed. Wouldn't it be challenging to catch up on what was missed, as well as learning what the teacher is currently teaching when you return? This would likely be challenging; thus, we can conclude that the more days of school missed, the lower a students final grade will be. As the number of days missed increases, the final grade will decrease; thus, the best fit line will have a negative slope.
We know, from attending school ourselves, that every day we learn something new in school. When a day of school is missed, there is a lot of catch up that needs to be done, but the teacher's instructions and lesson given each day can't be repeated the day you return, because the teacher has to move on with the rest of the class. If you missed a week of school, that's five days of lessons that were missed. Wouldn't it be challenging to catch up on what was missed, as well as learning what the teacher is currently teaching when you return? This would likely be challenging; thus, we can conclude that the more days of school missed, the lower a students final grade will be. As the number of days missed increases, the final grade will decrease; thus, the best fit line will have a negative slope.
Compare your answer with the correct one above
Matt conducted a statistical experiment to determine the relationship between yearly salary earned and age. In this study, he assigned age (in years) as the independent variable, and yearly salary as the dependent variable. He plotted his results on a scatter plot. If the results follow a linear relationship, what is a reasonable conclusion that could be found based these results?
Matt conducted a statistical experiment to determine the relationship between yearly salary earned and age. In this study, he assigned age (in years) as the independent variable, and yearly salary as the dependent variable. He plotted his results on a scatter plot. If the results follow a linear relationship, what is a reasonable conclusion that could be found based these results?
To help us answer this question, let's think about what we know about jobs:
If you were to get a part time job when you turn  , it's likely that you'll make minimum wage because it's your first job and you haven't finished high school, nor would you have a college education. However, if you think about a doctor, graduating from medical school when he/she is about
  years old, the doctor is likely going to make a lot more than minimum wage because he's gone through high school, college, and medical school. As you can probably assume, doctors make a salary much higher than minimum wage. Based on this scenario, we can conclude that as age increases, salary increases; thus, the slope of the best fit line will have a positive slope.
To help us answer this question, let's think about what we know about jobs:
If you were to get a part time job when you turn
Compare your answer with the correct one above
Mrs. Frame conducted a statistical experiment to determine the relationship between test grades and the number of hours her students spent studying. In this study, she assigned the number of hours spent studying as the independent variable, and the test grades (in percentages) were assigned as the dependent variable. She plotted her results on a scatter plot. If the results follow a linear relationship, what is a reasonable conclusion that could be found based these results?
Mrs. Frame conducted a statistical experiment to determine the relationship between test grades and the number of hours her students spent studying. In this study, she assigned the number of hours spent studying as the independent variable, and the test grades (in percentages) were assigned as the dependent variable. She plotted her results on a scatter plot. If the results follow a linear relationship, what is a reasonable conclusion that could be found based these results?
We know, from attending school ourselves, that when we have a test coming up that we want to do well on, we'll study for the test. Normally, the harder you study and the more time you spend studying, the more likely you are to do well on the test. If you don't study at all, and don't know the material that's being covered on a test, you'll like do poorly on a test; thus, we can conclude that the more time we spend studying, the higher our test grade will be. As the number of hours studied increases, the score on the test will increase; thus, the best fit line will have a positive slope.
We know, from attending school ourselves, that when we have a test coming up that we want to do well on, we'll study for the test. Normally, the harder you study and the more time you spend studying, the more likely you are to do well on the test. If you don't study at all, and don't know the material that's being covered on a test, you'll like do poorly on a test; thus, we can conclude that the more time we spend studying, the higher our test grade will be. As the number of hours studied increases, the score on the test will increase; thus, the best fit line will have a positive slope.
Compare your answer with the correct one above
A school principal conducted a statistical experiment to determine the relationship between and the number of hours spent studying each week. In this study, the principal assigned the number of hours spent studying as the independent variable, and the was assigned as the dependent variable. He plotted his results on a scatter plot. If the results follow a linear relationship, what is a reasonable conclusion that could be found based these results?
A school principal conducted a statistical experiment to determine the relationship between
We know, from attending school ourselves, that completing homework assignments and studying for quizzes and tests means that we will do better in school than if we didn't do those things. Completing homework and studying for tests takes time outside of school. Normally, the harder you study and the more time you spend studying, the more likely you are to do well in school. If you don't study at all, nor spend anytime completing homework assignments, your school grade will likely be lower than if you had spent time preparing and completing assignments; thus, we can conclude that the more time we spend studying, the higher our will be. As the number of hours studied increases, the will increase; thus, the best fit line will have a positive slope.
We know, from attending school ourselves, that completing homework assignments and studying for quizzes and tests means that we will do better in school than if we didn't do those things. Completing homework and studying for tests takes time outside of school. Normally, the harder you study and the more time you spend studying, the more likely you are to do well in school. If you don't study at all, nor spend anytime completing homework assignments, your school grade will likely be lower than if you had spent time preparing and completing assignments; thus, we can conclude that the more time we spend studying, the higher our
Compare your answer with the correct one above