Data Analysis and Probability - ISEE Primary 2 Math
Card 0 of 2
Question
Look at the chart below. If we add  more apples, how many more apples will we have?
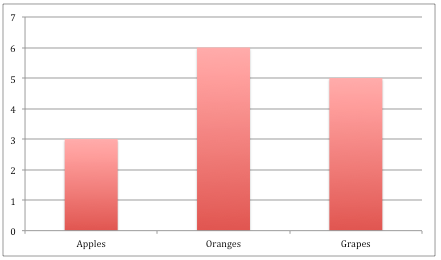
Look at the chart below. If we add
Answer
Looking at the graph, we first need to figure out how many apples we are starting with. We are starting with  apples and we are going to add
  more apples, which means we will have
  apples.

Looking at the graph, we first need to figure out how many apples we are starting with. We are starting with
Compare your answer with the correct one above
Question
Look at the chart below. How many grapes are there?
Look at the chart below. How many grapes are there?
Answer
In the chart, grapes are shown in the last bar, on the right. That bar goes up to the number  , which means there are
  grapes.
In the chart, grapes are shown in the last bar, on the right. That bar goes up to the number
Compare your answer with the correct one above
Tap the card to reveal the answer