How to find the answer from a table
Practice Questions
ISEE Middle Level Quantitative Reasoning › How to find the answer from a table
The table below gives the population of Buchanan City in each census year from 1930 to 1980.

The population figures are not available for 1990, 2000, or 2010, but it is known that the population has not decreased since 1980.
Which is the greater quantity?
(a) The population of Buchanan City in 2010
(b)

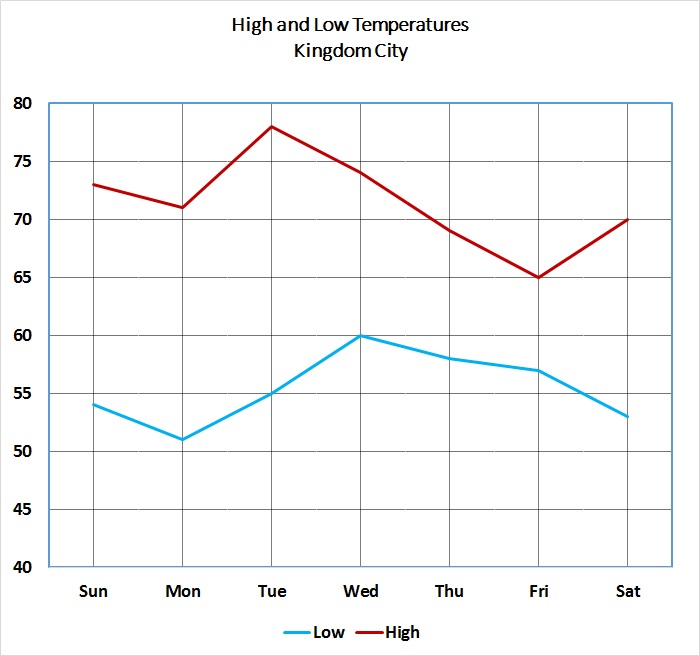
Refer to the above graph, which shows the high and low temperatures for Kingdom City over a one-week period.
On how many days did the temperature fall below 55 degrees?
Refer to the above graph, which shows the high and low temperatures for Kingdom City over a one-week period.
On how many days did the difference between the high and low temperatures reach or exceed fifteen degrees?
The table below gives the population of Buchanan City in each census year from 1930 to 1980.

In 1930, 81% of the population of Buchanan City was non-White; in 1980, 61% was non-White.
Which is the greater quantity?
(a) The number of non-Whites living in Buchanan City in 1930
(b) The number of non-Whites living in Buchanan City in 1980
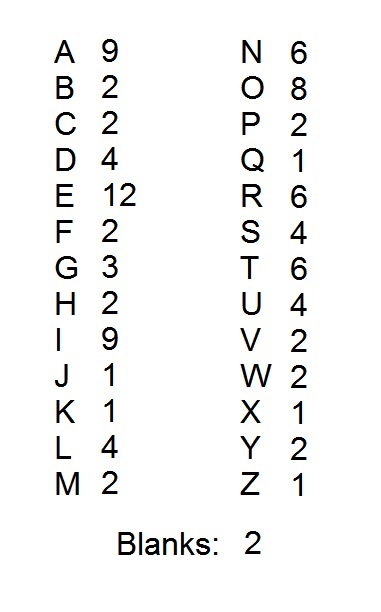
A popular word game uses one hundred tiles, each of which is marked with a letter or a blank. The distribution of the tiles is shown above, with each letter paired with the number of tiles marked with that letter. Notice that there are two blank tiles.
How many consonants are represented by as many tiles as there are "U" tiles?
(Note: for this problem, "Y" is considered a consonant)
The table below gives the population of Buchanan City in each census year from 1930 to 1980.

Which is the greater quantity?
(a) The population of Buchanan City in 1965
(b) The population of Buchanan City in 1975
The table below gives the population of Buchanan City in each census year from 1930 to 1980.

Which is the greater quantity?
(a) The growth in the population of Buchanan City between 1930 and 1940
(b) The growth in the population of Buchanan City between 1950 and 1960
Refer to the above graph, which shows the high and low temperatures for Kingdom City over a one-week period.
On how many days did the temperature exceed 70 degrees?
Use the chart below to answer the question.

How many students in Mr. Ray's class have a pet?
Use the chart below to answer the question.

How many students have a sibling in the second grade group and the first grade group?