Venn Diagrams - ISEE Lower Level (grades 5-6) Mathematics Achievement
Card 0 of 19
If Jill likes blue, yellow, tan and green, and Doug likes red, tan, black and green, which Venn diagram is correct?
If Jill likes blue, yellow, tan and green, and Doug likes red, tan, black and green, which Venn diagram is correct?
The middle portion of the diagram is the area that both circles share, so the color name that belongs in both circles should go in the middle area. Doug and Jill both like green and tan, so those colors should go in the middle. Only Jill likes blue and yellow, so these go on Jill's side. Only Doug likes red and black, so these go on Doug's side.
The middle portion of the diagram is the area that both circles share, so the color name that belongs in both circles should go in the middle area. Doug and Jill both like green and tan, so those colors should go in the middle. Only Jill likes blue and yellow, so these go on Jill's side. Only Doug likes red and black, so these go on Doug's side.
Compare your answer with the correct one above
Students were asked if they prefer TV or radio. The following Venn Diagram depicts the number of students who said TV, radio, or both. How many students like both TV and radio?
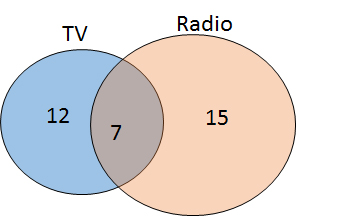
Students were asked if they prefer TV or radio. The following Venn Diagram depicts the number of students who said TV, radio, or both. How many students like both TV and radio?
The blue circle of the Venn diagram depicts the number of students who prefer TV, the orange circle depicts the number of students who prefer radio, and the region of overlap indicates the number of students who like both. Therefore, 7 students like both TV and radio.
The blue circle of the Venn diagram depicts the number of students who prefer TV, the orange circle depicts the number of students who prefer radio, and the region of overlap indicates the number of students who like both. Therefore, 7 students like both TV and radio.
Compare your answer with the correct one above
Thirty people are surveyed concerning their color preference. Eighteen people like blue, twenty-one like pink, and six don't like either color. How many people like both colors?
Thirty people are surveyed concerning their color preference. Eighteen people like blue, twenty-one like pink, and six don't like either color. How many people like both colors?
Start by removing the number who don't like either from the total number of peole surveyed:

Using set notation we get:
=n(B)+n(P)-n(B\bigcap P)") , or the number of people who like both colors,
, or the number of people who like both colors, ") , is equal to the number of people who like blue,
, is equal to the number of people who like blue, ") , plus the number of people who like pink,
, plus the number of people who like pink, ") , minus the number of people who like both blue and pink,
, minus the number of people who like both blue and pink, ") .
.


Start by removing the number who don't like either from the total number of peole surveyed:
Using set notation we get:
Compare your answer with the correct one above
Twenty-five students were surveyed concerning a classroom pet. Thirteen students wanted a lizard, fifteen wanted a frog, and five didnt want a pet at all. How many students wanted both a lizard and a frog?
Twenty-five students were surveyed concerning a classroom pet. Thirteen students wanted a lizard, fifteen wanted a frog, and five didnt want a pet at all. How many students wanted both a lizard and a frog?
Start by removing the number who don't like either from the total number of students surveyed:

Using set notation we get:
=n(F)+n(L)-n(F\bigcap L)") , or the number of people who like both pets,
, or the number of people who like both pets, ") , is equal to the number of people who like frogs,
, is equal to the number of people who like frogs, ") , plus the number of people who like lizards,
, plus the number of people who like lizards, ") , minus the number of people who like both frogs and lizards,
, minus the number of people who like both frogs and lizards, ") .
.


Start by removing the number who don't like either from the total number of students surveyed:
Using set notation we get:
Compare your answer with the correct one above
Fifty people were surveyed. Twenty-three people liked the baseball team from Chicago, thirty-five like the baseball team from St. Louis, and ten don't like either team. How many people like both teams?
Fifty people were surveyed. Twenty-three people liked the baseball team from Chicago, thirty-five like the baseball team from St. Louis, and ten don't like either team. How many people like both teams?
Start by removing the number who don't like either team from the total number of people surveyed:

Using set notation we get:
=n(Chicago)+n(St.Louis)-n(Chicago\bigcap St.Louis)") , or the number of people who like both teams,
, or the number of people who like both teams, ") , is equal to the number of people who like the Cubs,
, is equal to the number of people who like the Cubs, ") , plus the number of people who like the Cardinals,
, plus the number of people who like the Cardinals, ") , minus the number of people who like both teams,
, minus the number of people who like both teams, ") .
.


Start by removing the number who don't like either team from the total number of people surveyed:
Using set notation we get:

Compare your answer with the correct one above
Twenty-five students are surveyed. Twelve students like math, fifteen like science, and six don't like either subject. How many students like both math and science?
Twenty-five students are surveyed. Twelve students like math, fifteen like science, and six don't like either subject. How many students like both math and science?
Start by removing the number who don't like either from the total number of students surveyed:

Using set notation we have:
=n(M)+n(S)-n(M\bigcap S)") , or the number of people who like both subjects,
, or the number of people who like both subjects, ") , is equal to the number of people who like math,
, is equal to the number of people who like math, ") , plus the number of people who like science,
, plus the number of people who like science, ") , minus the number of people who like both math and science
, minus the number of people who like both math and science ") .
.


Start by removing the number who don't like either from the total number of students surveyed:
Using set notation we have:
Compare your answer with the correct one above
Fifty people are surveyed at the zoo. Thirty-seven liked the Great Apes, twenty-two liked the Reptile House, and eleven didn't like either. How many people liked both the Great Apes and the Reptile House?
Fifty people are surveyed at the zoo. Thirty-seven liked the Great Apes, twenty-two liked the Reptile House, and eleven didn't like either. How many people liked both the Great Apes and the Reptile House?
Start by removing the number who don't like either from the total number of people surveyed:

Using set notation we have:
=n(A)+n(R)-n(A\bigcap R)") , or the number of people who like both animals,
, or the number of people who like both animals, ") , is equal to the number of people who like apes,
, is equal to the number of people who like apes, ") , plus the number of people who like reptiles,
, plus the number of people who like reptiles, ") , minus the number of people who like both apes and lizards,
, minus the number of people who like both apes and lizards, ") .
.


Start by removing the number who don't like either from the total number of people surveyed:
Using set notation we have:
Compare your answer with the correct one above
Use the following Venn Diagram to answer the question.
What hobbies to both Andy and Mary enjoy?
Use the following Venn Diagram to answer the question.
What hobbies to both Andy and Mary enjoy?
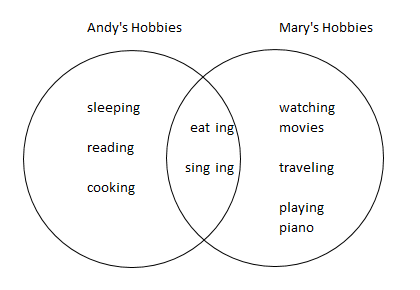
A Venn Diagram is made up of two circles. Each circle represents something, and the section where they intersect shows what those two circles have in common. So, in the Venn Diagram
we can see Andy's hobbies on the left and Mary's hobbies on the right. The section in the middle shows the hobbies Andy and Mary have in common.
So, to answer the question, what hobbies do Andy and Mary have in common, we can see that they both enjoy eating and singing.
Compare your answer with the correct one above
Use the following Venn Diagram to answer the question.

What hobbies do Andy and Mary have in common?
Use the following Venn Diagram to answer the question.
What hobbies do Andy and Mary have in common?
Let's look at the Venn Diagram.
We can see the first circle contains Andy's hobbies, and the second circle contains Mary's hobbies. The place in the middle, where the 2 circles intersect, shows the hobbies that both Andy and Mary enjoy. Or the hobbies they have in common. You can see they are a part of each person's circle.
So, the hobbies that are in the middle are eating and singing. Therefore, the hobbies that Andy and Mary have in common are eating and singing.
Compare your answer with the correct one above
Define universal set  to be the set of integers from 1 to 20 inclusive.
Define sets  as follows:


Which of the following would be the set of all elements that would go into the grayed region in the above Venn diagram?
Define universal set
Define sets
Which of the following would be the set of all elements that would go into the grayed region in the above Venn diagram?
The grayed region is the set of all elements that are in  - that is, in both
  and
and  . This set is

The grayed region is the set of all elements that are in
Compare your answer with the correct one above
Define universal set  to be the set of integers from 1 to 20 inclusive.
Define sets  as follows:


Which of the following would be the set of all elements that would go into the grayed region in the above Venn diagram?
Define universal set
Define sets
Which of the following would be the set of all elements that would go into the grayed region in the above Venn diagram?
The grayed region is the set of all elements that are in  - that is, in
  but not
  . This set is

The grayed region is the set of all elements that are in
Compare your answer with the correct one above
The following Venn diagram depicts the number of students who like soccer, football, or both. How many students like soccer but not football?
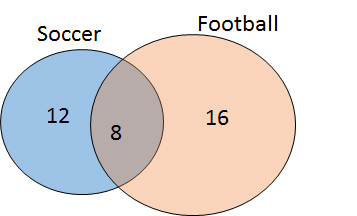
The following Venn diagram depicts the number of students who like soccer, football, or both. How many students like soccer but not football?
A Venn diagram is used to demonstrate the number of people (or things) in particular categories. The regions of the circle that are overlapping indicate the number of individuals that belong to multiple groups. Therefore, based on this diagram, 12 students like soccer only, 16 like football only, and 8 like both.
A Venn diagram is used to demonstrate the number of people (or things) in particular categories. The regions of the circle that are overlapping indicate the number of individuals that belong to multiple groups. Therefore, based on this diagram, 12 students like soccer only, 16 like football only, and 8 like both.
Compare your answer with the correct one above
Use the Venn Diagram to answer the question.
All of the sixth grade students at Park Middle School play at least one instrument.There are 60 total sixth graders at Park Middle School.
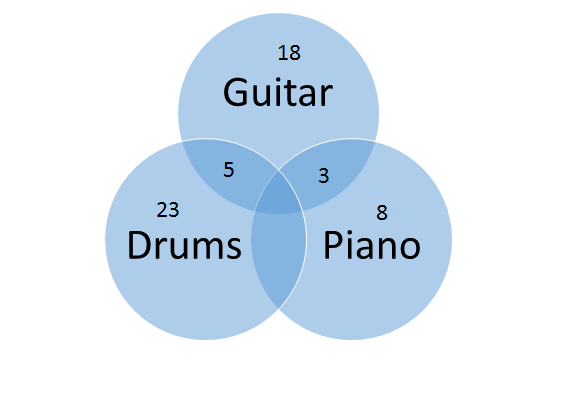
How many students play both the drums and the guitar, but do not play the piano?
Use the Venn Diagram to answer the question.
All of the sixth grade students at Park Middle School play at least one instrument.There are 60 total sixth graders at Park Middle School.
How many students play both the drums and the guitar, but do not play the piano?
The shaded area where the circle that contains the word guitar overlaps with the circle that contains the word drums has the number 5. It is incorrect to add the total number of guitar players to the total number of drum players because we are only looking for students who play both instruments.
The shaded area where the circle that contains the word guitar overlaps with the circle that contains the word drums has the number 5. It is incorrect to add the total number of guitar players to the total number of drum players because we are only looking for students who play both instruments.
Compare your answer with the correct one above
Use the Venn Diagram to answer the question.
All of the sixth grade students at Park Middle School play at least one instrument.There are 60 total sixth graders at Park Middle School.
Based on the information in the diagram, how many students play the guitar?
Use the Venn Diagram to answer the question.
All of the sixth grade students at Park Middle School play at least one instrument.There are 60 total sixth graders at Park Middle School.
Based on the information in the diagram, how many students play the guitar?
18 students play the guitar, but you must also add the 5 students who play the guitar and drums and the 3 students who play the guitar and piano.

18 students play the guitar, but you must also add the 5 students who play the guitar and drums and the 3 students who play the guitar and piano.
Compare your answer with the correct one above
Use the Venn Diagram to answer the question.
All of the sixth grade students at Park Middle School play at least one instrument.There are 60 total sixth graders at Park Middle School.
If one student plays all three instruments, how many students play both the drums and the piano, but not the guitar?
There are 60 total students. If 1 person plays all 3 instruments, then add that to all of the other numbers on the Venn Diagram to see that 58 students are represented on the Venn Diagram. Subtract that number from the total number of students to find the number of students in the missing category (those who play both the drums and the piano, but not the guitar).


There are 60 total students. If 1 person plays all 3 instruments, then add that to all of the other numbers on the Venn Diagram to see that 58 students are represented on the Venn Diagram. Subtract that number from the total number of students to find the number of students in the missing category (those who play both the drums and the piano, but not the guitar).
Compare your answer with the correct one above
The intersection point of a venn diagram represents the probability of niether event happening. True or false?
The intersection point of a venn diagram represents the probability of niether event happening. True or false?
The intersection of a venn diagram represents when both events happen at the same time, not when neither happen.
The intersection of a venn diagram represents when both events happen at the same time, not when neither happen.
Compare your answer with the correct one above
Use the following Venn Diagram to answer the question.
What hobbies does Andy enjoy doing?
Use the following Venn Diagram to answer the question.
What hobbies does Andy enjoy doing?
When looking at a Venn Diagram, we can see that it is made up of two circles. In this Venn Diagram
we can see Andy's hobbies on the left and Mary's hobbies on the right. We also see what hobbies they have in common in the center where the two circles intersect.
Now, when looking at Andy's circle containing his hobbies, we see that he enjoys sleeping, reading, and cooking. His circle is also part of the intersection, so we must include those hobbies as well. So, he also enjoys eating and singing.
So, overall, Andy's hobbies include sleeping, reading, cooking, eating, and singing.
Compare your answer with the correct one above
The area when two circles on a Venn Diagram cross each other is when  of the events occurs. True or False?
The area when two circles on a Venn Diagram cross each other is when
The point where two circles on a Venn Diagram intersect is the point where both of the events occur, not when neither occur.
The point where two circles on a Venn Diagram intersect is the point where both of the events occur, not when neither occur.
Compare your answer with the correct one above
Use the following Venn Diagram to answer the question.
What hobbies does Andy enjoy doing?
Use the following Venn Diagram to answer the question.
What hobbies does Andy enjoy doing?
When looking at a Venn Diagram, we can see that it is made up of two circles. In this Venn Diagram we can see Andy's hobbies on the left and Mary's hobbies on the right. We also see what hobbies they have in common in the center where the two circles intersect.
Now, when looking at Andy's circle containing his hobbies, we see that he enjoys sleeping, reading, and cooking. His circle is also part of the intersection, so we must include those hobbies as well. So, he also enjoys eating and singing.
So, overall, Andy's hobbies include sleeping, reading, cooking, eating, and singing.
Compare your answer with the correct one above