How to find the percentage of a sector from an angle - Intermediate Geometry
Card 0 of 15
The central angle of a sector is 72o. What percentage of the circle is comprised by the sector?
The central angle of a sector is 72o. What percentage of the circle is comprised by the sector?
The arc length of a sector, in degrees, is equal to the central angle. The total number of a degrees of a circle is 360. Therefore, we can use a proportion to calculate the percentage.


Therefore, 20% of the circle is comprised of the sector.
The arc length of a sector, in degrees, is equal to the central angle. The total number of a degrees of a circle is 360. Therefore, we can use a proportion to calculate the percentage.
Therefore, 20% of the circle is comprised of the sector.
Compare your answer with the correct one above
A sector of a circle has a central angle of  . What percentage of the circle does the sector occupy?
A sector of a circle has a central angle of
A whole circle is  . We therefore need to find the percent. We can do this by dividing.

A whole circle is
Compare your answer with the correct one above
A circle graph is used to depict the results from a survey given to high school students regarding their favorite sport. The sector representing baseball measures 52 degrees. What percent of the high schoolers who took the survey prefer baseball over any other sport?
A circle graph is used to depict the results from a survey given to high school students regarding their favorite sport. The sector representing baseball measures 52 degrees. What percent of the high schoolers who took the survey prefer baseball over any other sport?
To convert the angle of a sector in a circle to the percentage of that sector you can set-up a proportion:  and then solve. The total number of degrees in a circle is 360, so you place 52 out of 360. The total percent being represented by a circle is 100, so you place
  (what you are trying to find) out of 100.
To convert the angle of a sector in a circle to the percentage of that sector you can set-up a proportion:
Compare your answer with the correct one above
A survey was given to 250 high schoolers asking them how they got to school each day. The sector representing the students that ride the bus is 100 degrees, the sector representing the students that drive their own car is 90 degrees, and the sector representing the students that walk or ride their bike is 85 degrees. What percent of students get to school in another manner (parents drop them off, etc)?
A survey was given to 250 high schoolers asking them how they got to school each day. The sector representing the students that ride the bus is 100 degrees, the sector representing the students that drive their own car is 90 degrees, and the sector representing the students that walk or ride their bike is 85 degrees. What percent of students get to school in another manner (parents drop them off, etc)?
To find the missing percentage, first you can add the 3 sectors' angle measures together to get 275 degrees.
Then subtract that from 360 degrees because you want this missing sector, which is 85 degrees.
Then set-up a proportion:
 and solve.
To find the missing percentage, first you can add the 3 sectors' angle measures together to get 275 degrees.
Then subtract that from 360 degrees because you want this missing sector, which is 85 degrees.
Then set-up a proportion:
Compare your answer with the correct one above
A circle graph represents the different types of pie you can find at a local bakery. The blueberry pie wedge measures 120 degrees, the apple pie wedge measures 110 degrees and the cherry pie wedge measures 130 degrees. What percent of pies in the bakery are either blueberry or cherry?
A circle graph represents the different types of pie you can find at a local bakery. The blueberry pie wedge measures 120 degrees, the apple pie wedge measures 110 degrees and the cherry pie wedge measures 130 degrees. What percent of pies in the bakery are either blueberry or cherry?
First add together the degrees that represent blueberry and cherry pie to get 250 degrees. You want to include both sectors because the question is asking for the percent of pies that is either blueberry or cherry.
Then set up a proportion:
 and solve for
  .
.
First add together the degrees that represent blueberry and cherry pie to get 250 degrees. You want to include both sectors because the question is asking for the percent of pies that is either blueberry or cherry.
Then set up a proportion:
Compare your answer with the correct one above
A circle graph represents the student population at a local high school. The sector representing boys measures 200 degrees. What percent of the high school is girls?
A circle graph represents the student population at a local high school. The sector representing boys measures 200 degrees. What percent of the high school is girls?
First subtract 200 from 360 to get the number of degrees making up the sector representing girls.
Then set-up a proportion:
 and solve for
  .
.
First subtract 200 from 360 to get the number of degrees making up the sector representing girls.
Then set-up a proportion:
Compare your answer with the correct one above
A survey was given to 300 local townspeople regarding their favorite local dish. The results of the survey are below, with the number of degrees of each sector representing each dish following.
Fried chicken, 87 degrees
Steak and potatoes, 75 degrees
Corned beef hash, 82 degrees
Chicken enchiladas, 94 degrees
Bison burger, 22 degrees
What percent of the local townspeople prefer a dish that includes chicken?
First add together the number of degrees of both sectors representing a dish with chicken (fried chicken and chicken enchiladas), 87 + 94.
Then set-up a proportion with this sum:
 and solve for
  .
.
First add together the number of degrees of both sectors representing a dish with chicken (fried chicken and chicken enchiladas), 87 + 94.
Then set-up a proportion with this sum:
Compare your answer with the correct one above
A pie chart represents the ages of children in a local basketball league. The data is shown below, with the age range of each sector followed by the number of degrees of that sector.
Ages 2-4, 20 degrees
Ages 5-7, 30 degrees
Ages 8-10, 100 degrees
Ages 11-13, 90 degrees
Ages 14-16, ? degrees
What percent of the children in the basketball league are between the ages of 14-16?
First add together the degrees of the sectors representing children ages 2-13. Then take that sum, 240 degrees, away from the total degrees of the circle, 360 degrees.
Finally set-up a proportion with the remaining degrees (120) which represents the sector of children ages 14-16.
Solve your proportion:
 .
.
First add together the degrees of the sectors representing children ages 2-13. Then take that sum, 240 degrees, away from the total degrees of the circle, 360 degrees.
Finally set-up a proportion with the remaining degrees (120) which represents the sector of children ages 14-16.
Solve your proportion:
Compare your answer with the correct one above
A circle chart represents the survey results of the following question:
How many hours a week do you typically spend watching TV?
The results are below, with the sector title and the number of degrees of each sector following.
Less than 1 hour, 40 degrees
1-4 hours, 45 degrees
5-8 hours, 30 degrees
9-12 hours, 100 degrees
13-16 hours, 85 degrees
17 hours or more, 60 degrees
What percent of people surveyed watch TV for 9 or more hours a week?
First, add together the degrees from the 3 sectors that include 9 or more hours of TV: 100 degrees, 85 degrees and 60 degrees.
Take this sum, 245 degrees, and set-up a proportion:
 and solve for
  .
.
First, add together the degrees from the 3 sectors that include 9 or more hours of TV: 100 degrees, 85 degrees and 60 degrees.
Take this sum, 245 degrees, and set-up a proportion:
Compare your answer with the correct one above
A circle graph represents the demographics of a major US city. The data is shown below with the category followed by the number of degrees making up that category's sector.
Black or African-American: 100 degrees
Hispanic or Latino: 100 degrees
White: 80 degrees
Two or more races: ? degrees
What percent of the city's population classifies themselves as being 2 or more races?
First, add together the degrees of the known sectors: 100 degrees, 100 degrees, and 80 degrees.
Subtract this sum (280 degrees) from the total number of degrees in a circle (360 degrees).
Take this difference to set-up a proportion:
 and solve for
  .
.
First, add together the degrees of the known sectors: 100 degrees, 100 degrees, and 80 degrees.
Subtract this sum (280 degrees) from the total number of degrees in a circle (360 degrees).
Take this difference to set-up a proportion:
Compare your answer with the correct one above
A survey was given to 1,000 middle school students across the United States, asking them to choose their favorite subject in school. The results of the survey are below, with each subject followed by the number of degrees composing that subject's sector in the circle graph displaying this data.
Math, 75 degrees
English, 58 degrees
Science, 62 degrees
Social Studies, 100 degrees
Music, Art or PE: 65 degrees
What percent of students prefer a subject that is not Music, Art or PE?
First, add together the degrees of the sectors representing Math, English, Science and Social Studies.
Take this sum, 295 and set-up a proportion:
 and solve for
  .
.
First, add together the degrees of the sectors representing Math, English, Science and Social Studies.
Take this sum, 295 and set-up a proportion:
Compare your answer with the correct one above
Reference a map of major cities on the West Coast to help you with this question!
A survey was given to fans throughout the West Coast, asking them who their favorite team was. The results are below with the team name and the degrees making up the sector representing that team in a circle graph that displayed this data.
Team A: 123 degrees
Team B: 89 degrees
Team C: 36 degrees
Team D: 20 degrees
Other: 92 degrees
What percent of fans prefere Team A, C, or D?
First add together the degrees from the sectors representing Teams A, C, and D.
Take this sum, 179 and set-up a proportion:
 and solve for
  .
.
First add together the degrees from the sectors representing Teams A, C, and D.
Take this sum, 179 and set-up a proportion:
Compare your answer with the correct one above
A pie chart depicts the favorite beverages of high schoolers. Below is the data with the beverage and the number of degrees making up that beverage's sector.
Soda: 86 degrees
Diet Soda: 44 degrees
Water: 55 degrees
Juice: 99 degrees
Lemonade: 66 degrees
Other: ? degrees
What percent of high schoolers prefer a beverage that was not specifically listed as a choice?
First add together the known sectors. Use that sum (350 degrees) and subtract from the total number of degrees in a circle (360 degrees).
Take that difference and set-up a proportion:
 and solve for
  .
.
First add together the known sectors. Use that sum (350 degrees) and subtract from the total number of degrees in a circle (360 degrees).
Take that difference and set-up a proportion:
Compare your answer with the correct one above
A circle graph displays data of the eye colors of a group of middle schoolers. The data is shown below with the eye color followed by the number of degrees composing that sector.
Brown: 208 degrees
Green: 20 degrees
Blue: 25 degrees
Hazel: 50 degrees
Other: 57 degrees
What percent of students have brown eyes?
Take the degrees representing the brown eye sector and set-up a proportion:
 and solve for
  .
.
Take the degrees representing the brown eye sector and set-up a proportion:
Compare your answer with the correct one above
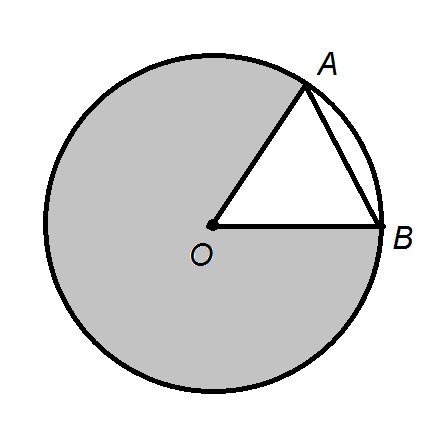
In the above diagram,  is an equilateral triangle. What percent of the circle has been shaded in?
In the above diagram,
The three interior angles of equilateral triangle  - in particular,
  - measure
  . This makes the unshaded sector of the circle a sector with a
  central angle, or, equivalently, a
  sector. The shaded sector is therefore one of measure
 ^{\circ } = 300^{\circ }") . It is therefore
. It is therefore

of the circle.
The three interior angles of equilateral triangle
of the circle.
Compare your answer with the correct one above