Using Scatter Plots - High School Math
Card 0 of 1
Question
Based on the scatter plot below, is there a correlation between the  and
and  variables? If so, describe the correlation.
Based on the scatter plot below, is there a correlation between the
Answer
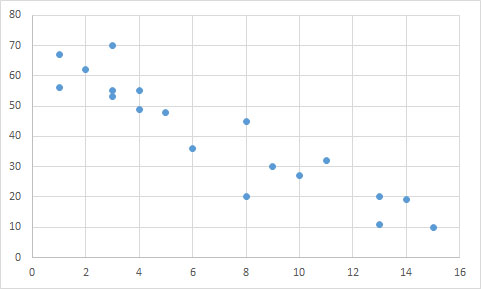
The data points follow an overall linear trend, as opposed to being randomly distributed. Though there are a few outliers, there is a general relationship between the two variables.
A line could accurately predict the trend of the data points, suggesting there is a linear correlation. Since the y-values decrease as the x-values increase, the correlation must be negative. We can see that a line connecting the upper-most and lower-most points would have a negative slope.
An exponential relationship would be curved, rather than straight.
Compare your answer with the correct one above
Tap the card to reveal the answer