Representing Data
Practice Questions
High School Math › Representing Data
Questions
4
1
The horizontal line in the box of the box and whisker plot represents _____________.

2
The horizontal line in the box of the box and whisker plot represents _____________.
3
Based on the scatter plot below, is there a correlation between the 

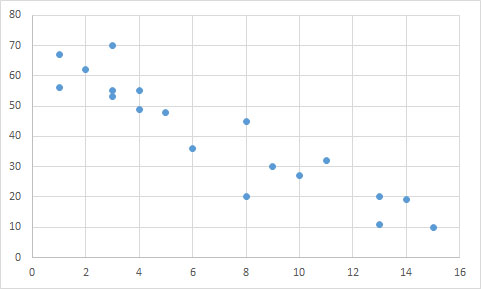
4
Based on the scatter plot below, is there a correlation between the