Diagrams, Graphs, and Tables
Practice Questions
GRE Subject Test: Chemistry › Diagrams, Graphs, and Tables
Questions
2
1
A researcher performs a Bradford assay to determine the quantity of an unknown protein in his sample. The standard protein returns absorbance values of 0.101, 0.204, 0.302, 0.405 for the respective quantities of 10ug, 20ug, 30ug, and 40ug of protein. The unknown sample returns an absorbance value of 0.265. What is the quantity of protein in the unknown sample?
2
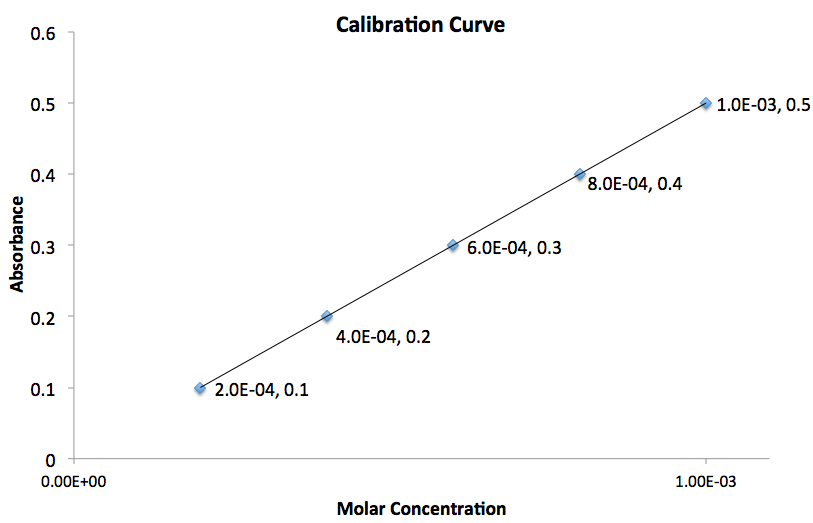
Using the graph given, what is the value for the slope of the line?