Graphing an Inequality with a Number Line
Practice Questions
GRE Quantitative Reasoning › Graphing an Inequality with a Number Line
Page 1 of 2
10 of 14
1
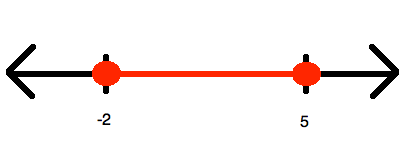
Which of the following inequalities is represented by the number line shown above?
2
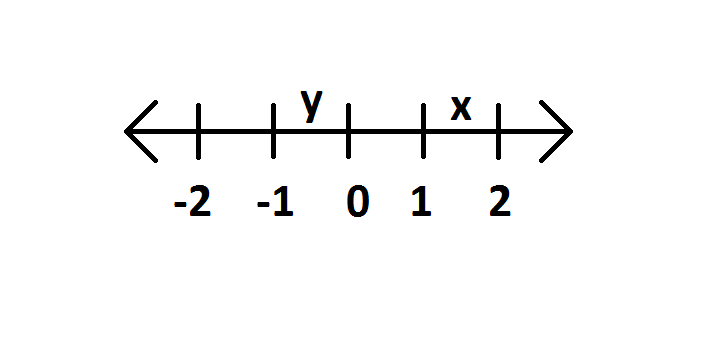
Which of the following inequalities is represented by the number line shown above?
3

Which of the following is a graph for the values of 
4
Which of the following is a graph for the values of
5


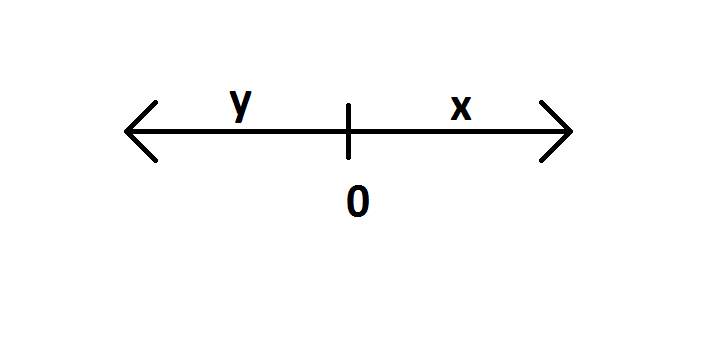
Which of the following is true?
6
Which of the following is true?
7

^2>0")

Which of the statements is always true?
8
Which of the statements is always true?
9

Which of the following is a graph for the values of 
10
Which of the following is a graph for the values of
Page 1 of 2