How to graph an inequality with a number line
Practice Questions
GRE Quantitative Reasoning › How to graph an inequality with a number line
Questions
7
1
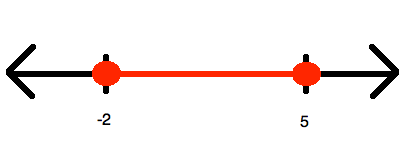
Which of the following inequalities is represented by the number line shown above?
2

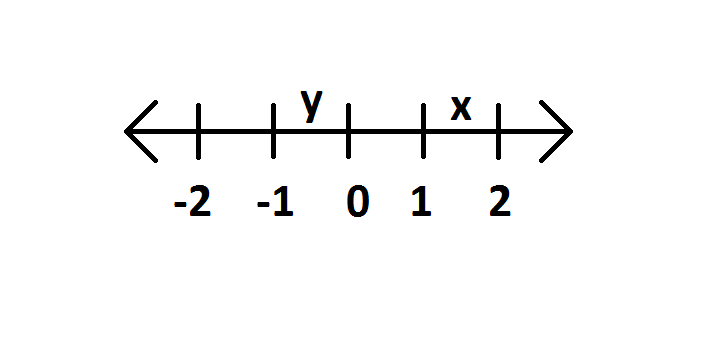
Which of the following is a graph for the values of 
3


Which of the following is true?
4

^2>0")

Which of the statements is always true?
5

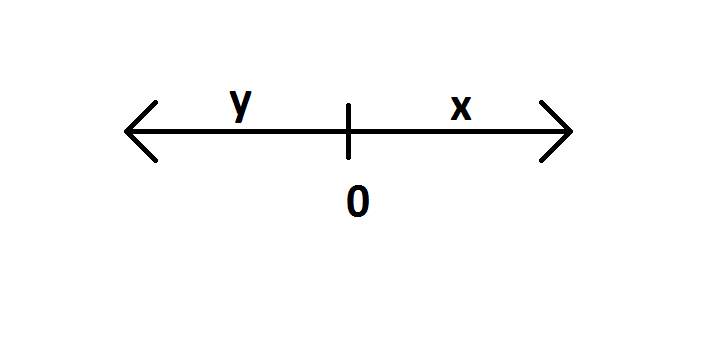
Which of the following is a graph for the values of 
6
Quantity A:
*(210237)")
Quantity B:
*(210789)")
7
On a real number line, x1 = -4 and x2 = 14. What is the distance between these two points?