Sectors
Practice Questions
GRE Quantitative Reasoning › Sectors
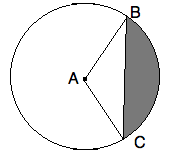
The circle above has a center of A, and points B and C lie on the circumference.


What is the area of the shaded region?
The circle above has a center of A, and points B and C lie on the circumference.
What is the area of the shaded region?
A given pizza with a 


What is the perimeter of a pie piece if the pie is sliced into 40 degree pieces and its area is 361π?
A given pizza with a
What is the perimeter of a pie piece if the pie is sliced into 40 degree pieces and its area is 361π?
John owns 8 black shirts, 7 red shirts, 6 blue shirts and 4 white shirts. If he wants to make a circle chart of his shirts, what is the degree angle corresponding to the "blue shirt section?"
John owns 8 black shirts, 7 red shirts, 6 blue shirts and 4 white shirts. If he wants to make a circle chart of his shirts, what is the degree angle corresponding to the "blue shirt section?"
A study was conducted to determine the effectiveness of a vaccine for the common cold (Rhinovirus sp.). 1000 patients were studied. Of those, 500 received the vaccine and 500 did not. The patients were then exposed to the Rhinovirus and the results were tabulated.
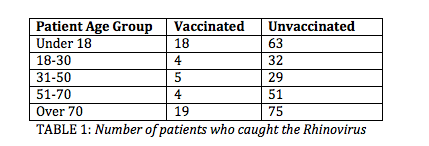
Table 1 shows the number of vaccinated and unvaccinated patients in each age group who caught the cold.
Suppose the scientists wish to create a pie chart reflecting a patient's odds of catching the virus depending on vaccination status and age group.
All 1000 patients are included in this pie chart.
What would be the angle of the arc for the portion of the chart representing vaccinated patients of all age groups who caught the virus?
A study was conducted to determine the effectiveness of a vaccine for the common cold (Rhinovirus sp.). 1000 patients were studied. Of those, 500 received the vaccine and 500 did not. The patients were then exposed to the Rhinovirus and the results were tabulated.
Table 1 shows the number of vaccinated and unvaccinated patients in each age group who caught the cold.
Suppose the scientists wish to create a pie chart reflecting a patient's odds of catching the virus depending on vaccination status and age group.
All 1000 patients are included in this pie chart.
What would be the angle of the arc for the portion of the chart representing vaccinated patients of all age groups who caught the virus?