Understanding table analyses
Practice Questions
GMAT Integrated Reasoning › Understanding table analyses
The table displays the academic class spread among Dawn County schools in 2005.
Based on the given information in the table, select the options that can be proven to be true.
I. No class is offered in less than one-third of the schools.
II. Every school in the district offers either Gym or at least one Art class (Painting or Sculpting).
III. Math is an academic class that is offered in all schools in Dawn County.
The table displays the academic class spread among Dawn County schools in 2005.
Based on the given information in the table, select the options that can be proven to be true.
I. At least half the school's in Dawn County support advanced placement courses.
II. The majority of schools's in Dawn County participate in offering a type of foreign language to their students.
III. The core subjects such as English and Math enroll the majority of students.
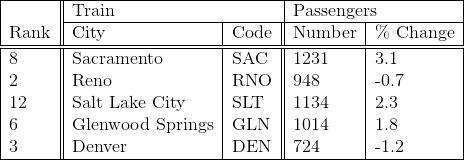
The table above give information for 2013 on the total passengers for 5 train stations in the western United States. These stations were chosen because in 2013 they were among the most popular. The table also includes the percent increase and decrease from the precious year.
Consider the following statements and determine whether the statements are true or false based on the information provided by the table.
I. The percent of change in the passenger count from 2012 created the rank identifier for 2013.
II. The train station that has the median number of passengers also has the median rank.
III. Over 50 percent of the stations that experienced a percentage increase are in the state of Utah.
The table displays the academic class spread among Dawn County schools in 2005.
Based on the given information in the table, select the options that can be proven to be true.
I. No class is offered in less than one-third of the schools.
II. Every school in the district offers either Gym or at least one Art class (Painting or Sculpting).
III. Math is an academic class that is offered in all schools in Dawn County.
The table above give information for 2013 on the total passengers for 5 train stations in the western United States. These stations were chosen because in 2013 they were among the most popular. The table also includes the percent increase and decrease from the precious year.
Consider the following statements and determine whether the statements are true or false based on the information provided by the table.
I. The percent of change in the passenger count from 2012 created the rank identifier for 2013.
II. The train station that has the median number of passengers also has the median rank.
III. Over 50 percent of the stations that experienced a percentage increase are in the state of Utah.


