Bar Graphs
Practice Questions
GED Math › Bar Graphs

Which question can be answered about Polk Middle School sixth graders' performance on the math portion of the SCAT by looking at the above bar graph?
Use the following bar graph to answer the question:
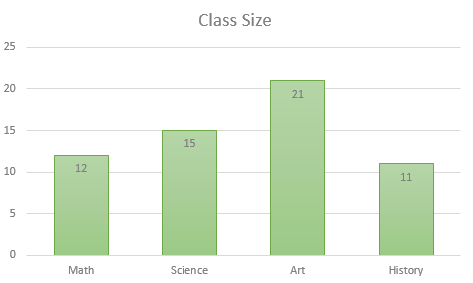
How many students are in Art class?
A class of 

What is the mode number of pets that are owned?
The following five countries rank highest in total energy consumption (source: CIA World Factbook website). Figures are given in megawatt-hours per year total:


A vertical bar graph is to be constructed so that its vertical axis is marked 
A class of
How many total pets are owned by the students in the class?
Refer to the above bar graph.
What percent of the students achieved a score above 500?
Refer to the above graph. Clarissa, a sixth grader at Polk, scored a 673 on the math portion of the SCAT. Which of the following could have been her rank among the students?
Use the following bar graph to answer the question:
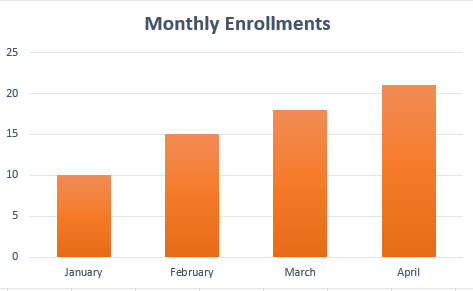
Approximately, how many enrollments were there in April?
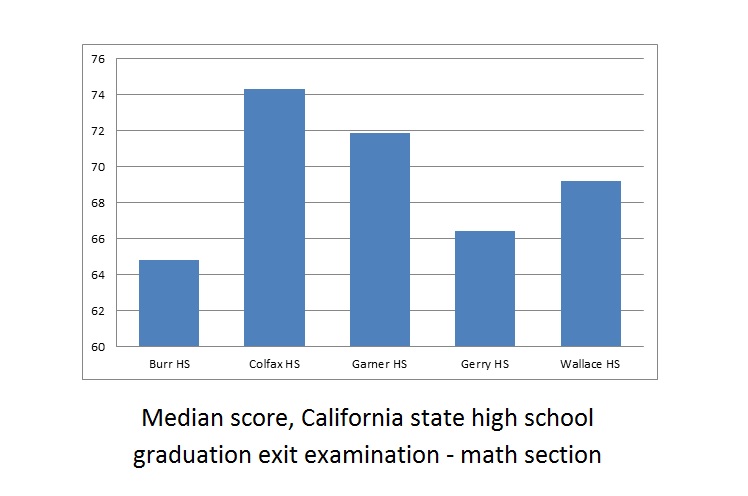
Refer to the above bar graph. The exit examination was given to all high school seniors in the above five schools.
Juanita attended Wallace High School and scored a 75 on the math portion. Wallace High School had 188 seniors take the examination. How many seniors could Juanitia have conceivably outscored?
Use the following bar graph to answer the question:
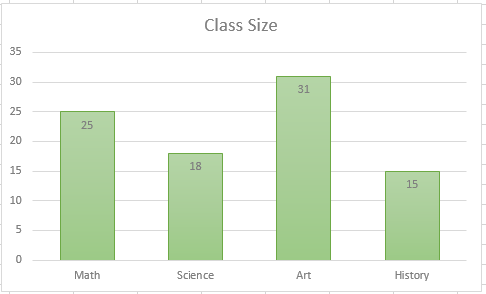
How many students are in the largest class?