Summarize Interpret Categorical Data in Two-Way Frequency Tables: CCSS.Math.Content.HSS-ID.B.5
Practice Questions
Common Core: High School - Statistics and Probability › Summarize Interpret Categorical Data in Two-Way Frequency Tables: CCSS.Math.Content.HSS-ID.B.5
Suppose a social scientist wants to know the effects of gender upon film preferences. She samples fifty men and women and asks them to mark their preference between to genres: documentaries and dramas. She then constructs a two-way frequency table as shown:
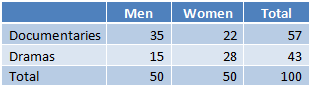
What is the conditional probability of men who like documentaries?
Suppose a social scientist wants to know the effects of gender upon film preferences. She samples fifty men and women and asks them to mark their preference between to genres: documentaries and dramas. She then constructs a two-way frequency table as shown:
What is the relative probability of men who prefer dramas?
Suppose a social scientist wants to know the effects of gender upon film preferences. She samples fifty men and women and asks them to mark their preference between to genres: documentaries and dramas. She then constructs a two-way frequency table as shown:
What is the conditional probability of men who like documentaries?
Suppose a social scientist wants to know the effects of gender upon film preferences. She samples fifty men and women and asks them to mark their preference between to genres: documentaries and dramas. She then constructs a two-way frequency table as shown:

What is the relative probability of men who prefer dramas?
Suppose a social scientist wants to know the effects of gender upon film preferences. She samples fifty men and women and asks them to mark their preference between to genres: documentaries and dramas. She then constructs a two-way frequency table as shown:

What is the conditional probability of men who like documentaries?
Suppose a social scientist wants to know the effects of gender upon film preferences. She samples fifty men and women and asks them to mark their preference between to genres: documentaries and dramas. She then constructs a two-way frequency table as shown:

What is the relative probability of men who prefer dramas?