High School: Statistics & Probability
Practice Questions
Common Core: High School - Statistics and Probability › High School: Statistics & Probability
Suppose a social scientist wants to know the effects of gender upon film preferences. She samples fifty men and women and asks them to mark their preference between to genres: documentaries and dramas. She then constructs a two-way frequency table as shown:
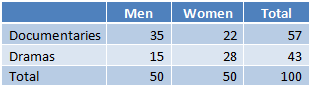
What is the relative probability of men who prefer dramas?
Suppose a social scientist wants to know the effects of gender upon film preferences. She samples fifty men and women and asks them to mark their preference between to genres: documentaries and dramas. She then constructs a two-way frequency table as shown:
What is the conditional probability of men who like documentaries?
Two students have taken ten math tests in the first quarter of the school year. Joe received the following scores on these ten tests:

Melissa obtained the following ten scores:

Predict which student will get the higher score on the next test.
Two students have taken ten math tests in the first quarter of the school year. Joe received the following scores on these ten tests:
Melissa obtained the following ten scores:
Predict which student will get the higher score on the next test.
Two students have taken ten math tests in the first quarter of the school year. Joe received the following scores on these ten tests:
Melissa obtained the following ten scores:
Predict which student will get the higher score on the next test.
Use technology to find the least squares regression equation for the following data set.
 & v: Milage (in MPG) \ \hline 6002 & 9 \ \hline 3610 & 14 \ \hline 5671 & 24 \ \hline 7226 & 38 \ \hline 2950 & 21 \ \hline 5519 & 10 \ \hline 9288 & 38 \ \hline 2650 & 16 \ \hline 6142 & 12 \ \hline 8885 & 12 \ \hline 2670 & 49 \ \hline 9466 & 22 \ \hline 6258 & 33 \ \hline 2984 & 19 \ \hline 3825 & 24 \ \hline 540 & 15 \ \hline 6056 & 43 \ \hline 7012 & 45 \ \hline 1382 & 27 \ \hline 6067 & 23 \ \hline 8047 & 5 \ \hline 8322 & 23 \ \hline 10164 & 31 \ \hline 9161 & 34 \ \hline 638 & 5 \ \hline 1590 & 38 \ \hline 7930 & 30 \ \hline 6861 & 49 \ \hline 7699 & 40 \ \hline 9060 & 19 \ \hline 2651 & 41 \ \hline 3529 & 26 \ \hline 9230 & 26 \ \hline 3157 & 14 \ \hline 5283 & 9 \ \hline 7879 & 36 \ \hline 9385 & 36 \ \hline 1077 & 44 \ \hline 7592 & 26 \ \hline 3848 & 39 \ \hline \end{tabular}")
Market analysts for an automotive company randomly sampled five hundred new car buyers using a simple survey. This survey recorded the preferences of future consumers. The analysts documented several preferences in the same survey: engine size (i.e. an eight cylinder—V8—or a six cylinder—V6) and paint color. The data are present in the provided table.

What of the following correctly calculates the probability intersection future consumers that will want a car that is Black Pearl and has a V8?
Suppose a social scientist wants to know the effects of gender upon film preferences. She samples fifty men and women and asks them to mark their preference between to genres: documentaries and dramas. She then constructs a two-way frequency table as shown:
What is the conditional probability of men who like documentaries?
A researcher for a motor vehicle company wants to observe the relationship between a vehicle's weight and mileage. He decides to investigate 40 vehicles and tabulates the following data.

Afterwards, he plotted the data into a scatter plot and fitted a trendline to the graph.

Which of the following is the best conclusion that can be made about the data's linearity?
Suppose a social scientist wants to know the effects of gender upon film preferences. She samples fifty men and women and asks them to mark their preference between to genres: documentaries and dramas. She then constructs a two-way frequency table as shown:
What is the relative probability of men who prefer dramas?