Graph's Domain: CCSS.Math.Content.HSF-IF.B.5 - Common Core: High School - Functions
Card 0 of 12
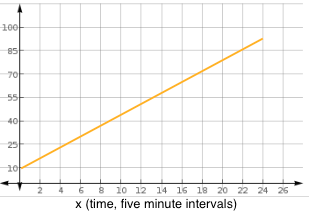
A vehicle increases its speed by  miles per hour every five minutes for two hours resulting in a maximum speed of 95 miles per hour. If
 ") represents this function, what is the domain of
represents this function, what is the domain of  ?
?
A vehicle increases its speed by
This particular question is testings one's ability to recognize characteristics of a function in terms of its context. Specifically, it is testing the ability to identify the domain of a function, or in other words, the possible input values that logically and mathematically work for the situation that is described by ") .
.
For the purpose of Common Core Standards, "relate the domain of a function to its graph and, where applicable, to the quantitative relationship it describes" falls within the Cluster B of "interpret functions that arise in applications in terms of the context" concept (CCSS.MATH.CONTENT.HSF-IF.B.5).
Knowing the standard and the concept for which it relates to, we can now do the step-by-step process to solve the problem in question.
Step 1: Identify what the question is asking for.
This question is asking to find the domain, possible x values that make sense for this situation  .
.
Step 2: Use the information that describes ") and create a graph that could possibly fit.
and create a graph that could possibly fit.
Let us identify the known information of the function.
 is in intervals of "miles per every five minutes" and goes from zero to two hours. Therefore to find the units that the
  -axis will have, convert two hours into minutes and then into intervals of five minutes.


The maximum speed is 95 miles per hour. Therefore, the  -axis spans from zero to 95.
At some value  the function reaches a maximum value of,
=95") .
.
Since the question states, "A vehicle increases its speed by  miles per hour every five minutes for two hours", a linear relationship being time and speed is assumed.
Using the known information creates the graph below.
Step 3: Using the graph above, identify the domain.
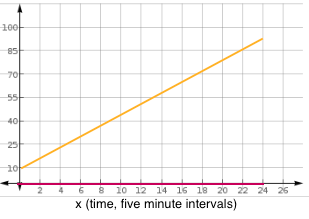
Recalling that the domain of a function is the interval of  values that result in a real output that lies in the range of the function. In the above graph the red line indicates the domain of the function. In mathematical terms,
 .
.
This particular question is testings one's ability to recognize characteristics of a function in terms of its context. Specifically, it is testing the ability to identify the domain of a function, or in other words, the possible input values that logically and mathematically work for the situation that is described by
For the purpose of Common Core Standards, "relate the domain of a function to its graph and, where applicable, to the quantitative relationship it describes" falls within the Cluster B of "interpret functions that arise in applications in terms of the context" concept (CCSS.MATH.CONTENT.HSF-IF.B.5).
Knowing the standard and the concept for which it relates to, we can now do the step-by-step process to solve the problem in question.
Step 1: Identify what the question is asking for.
This question is asking to find the domain, possible x values that make sense for this situation
Step 2: Use the information that describes
Let us identify the known information of the function.
The maximum speed is 95 miles per hour. Therefore, the
At some value
Since the question states, "A vehicle increases its speed by
Using the known information creates the graph below.
Step 3: Using the graph above, identify the domain.
Recalling that the domain of a function is the interval of
Compare your answer with the correct one above
A vehicle increases its speed by miles per hour every five minutes for 45 minutes resulting in a maximum speed of 33 miles per hour. If represents this function, what is the domain of ?
A vehicle increases its speed by
This particular question is testings one's ability to recognize characteristics of a function in terms of its context. Specifically, it is testing the ability to identify the domain of a function, or in other words, the possible input values that logically and mathematically work for the situation that is described by .
For the purpose of Common Core Standards, "relate the domain of a function to its graph and, where applicable, to the quantitative relationship it describes" falls within the Cluster B of "interpret functions that arise in applications in terms of the context" concept (CCSS.MATH.CONTENT.HSF-IF.B.5).
Knowing the standard and the concept for which it relates to, we can now do the step-by-step process to solve the problem in question.
Step 1: Identify what the question is asking for.
This question is asking to find the domain, possible x values that make sense for this situation .
Step 2: Use the information that describes and create a graph that could possibly fit.
Let us identify the known information of the function.
is in intervals of "miles per every five minutes" and goes from zero to 45 minutes. Therefore to find the units that the -axis will have, convert 45 minutes into intervals of five minutes.

The maximum speed is 33 miles per hour. Therefore, the -axis spans from zero to 33.
At some value the function reaches a maximum value of,
=33") .
.
Since the question states, "A vehicle increases its speed by miles per hour every five minutes for 45 minutes", a linear relationship being time and speed is assumed.
Using the known information creates the graph below.

Step 3: Using the graph above, identify the domain.
Recalling that the domain of a function is the interval of values that result in a real output that lies in the range of the function. In mathematical terms,
 .
.
This particular question is testings one's ability to recognize characteristics of a function in terms of its context. Specifically, it is testing the ability to identify the domain of a function, or in other words, the possible input values that logically and mathematically work for the situation that is described by
For the purpose of Common Core Standards, "relate the domain of a function to its graph and, where applicable, to the quantitative relationship it describes" falls within the Cluster B of "interpret functions that arise in applications in terms of the context" concept (CCSS.MATH.CONTENT.HSF-IF.B.5).
Knowing the standard and the concept for which it relates to, we can now do the step-by-step process to solve the problem in question.
Step 1: Identify what the question is asking for.
This question is asking to find the domain, possible x values that make sense for this situation
Step 2: Use the information that describes
Let us identify the known information of the function.
The maximum speed is 33 miles per hour. Therefore, the
At some value
Since the question states, "A vehicle increases its speed by
Using the known information creates the graph below.
Step 3: Using the graph above, identify the domain.
Recalling that the domain of a function is the interval of
Compare your answer with the correct one above
A vehicle increases its speed by miles per hour every two minutes for twenty minutes resulting in a maximum speed of 25 miles per hour. If represents this function, what is the domain of ?
A vehicle increases its speed by
This particular question is testings one's ability to recognize characteristics of a function in terms of its context. Specifically, it is testing the ability to identify the domain of a function, or in other words, the possible input values that logically and mathematically work for the situation that is described by .
For the purpose of Common Core Standards, "relate the domain of a function to its graph and, where applicable, to the quantitative relationship it describes" falls within the Cluster B of "interpret functions that arise in applications in terms of the context" concept (CCSS.MATH.CONTENT.HSF-IF.B.5).
Knowing the standard and the concept for which it relates to, we can now do the step-by-step process to solve the problem in question.
Step 1: Identify what the question is asking for.
This question is asking to find the domain, possible x values that make sense for this situation .
Step 2: Use the information that describes and create a graph that could possibly fit.
Let us identify the known information of the function.
is in intervals of "miles per every two minutes" and goes from zero to 20 minutes. Therefore to find the units that the -axis will have, convert 20 minutes into intervals of two minutes.

The maximum speed is 25 miles per hour. Therefore, the -axis spans from zero to 25.
At some value the function reaches a maximum value of,
=25") .
.
Since the question states, "A vehicle increases its speed by miles per hour every two minutes for 20 minutes", a linear relationship being time and speed is assumed.
Using the known information creates the graph below.

Step 3: Using the graph above, identify the domain.
Recalling that the domain of a function is the interval of values that result in a real output that lies in the range of the function. In mathematical terms,
 .
.
This particular question is testings one's ability to recognize characteristics of a function in terms of its context. Specifically, it is testing the ability to identify the domain of a function, or in other words, the possible input values that logically and mathematically work for the situation that is described by
For the purpose of Common Core Standards, "relate the domain of a function to its graph and, where applicable, to the quantitative relationship it describes" falls within the Cluster B of "interpret functions that arise in applications in terms of the context" concept (CCSS.MATH.CONTENT.HSF-IF.B.5).
Knowing the standard and the concept for which it relates to, we can now do the step-by-step process to solve the problem in question.
Step 1: Identify what the question is asking for.
This question is asking to find the domain, possible x values that make sense for this situation
Step 2: Use the information that describes
Let us identify the known information of the function.
The maximum speed is 25 miles per hour. Therefore, the
At some value
Since the question states, "A vehicle increases its speed by
Using the known information creates the graph below.
Step 3: Using the graph above, identify the domain.
Recalling that the domain of a function is the interval of
Compare your answer with the correct one above
A vehicle decreases its speed by miles per hour every three minutes until the vehicle is at rest. Assume that the vehicle starts at 15 miles per hour. If represents this function, what is the domain of ?
A vehicle decreases its speed by
This particular question is testings one's ability to recognize characteristics of a function in terms of its context. Specifically, it is testing the ability to identify the domain of a function, or in other words, the possible input values that logically and mathematically work for the situation that is described by .
For the purpose of Common Core Standards, "relate the domain of a function to its graph and, where applicable, to the quantitative relationship it describes" falls within the Cluster B of "interpret functions that arise in applications in terms of the context" concept (CCSS.MATH.CONTENT.HSF-IF.B.5).
Knowing the standard and the concept for which it relates to, we can now do the step-by-step process to solve the problem in question.
Step 1: Identify what the question is asking for.
This question is asking to find the domain, possible x values that make sense for this situation .
Step 2: Use the information that describes and create a graph that could possibly fit.
Let us identify the known information of the function.
"A vehicle decreases its speed by miles per hour every three minutes until the vehicle is at rest", a linear relationship being time and speed is assumed.
Using the known information creates the graph below.

Step 3: Using the graph above, identify the domain.
Recalling that the domain of a function is the interval of values that result in a real output that lies in the range of the function. In mathematical terms,
 .
.
This particular question is testings one's ability to recognize characteristics of a function in terms of its context. Specifically, it is testing the ability to identify the domain of a function, or in other words, the possible input values that logically and mathematically work for the situation that is described by
For the purpose of Common Core Standards, "relate the domain of a function to its graph and, where applicable, to the quantitative relationship it describes" falls within the Cluster B of "interpret functions that arise in applications in terms of the context" concept (CCSS.MATH.CONTENT.HSF-IF.B.5).
Knowing the standard and the concept for which it relates to, we can now do the step-by-step process to solve the problem in question.
Step 1: Identify what the question is asking for.
This question is asking to find the domain, possible x values that make sense for this situation
Step 2: Use the information that describes
Let us identify the known information of the function.
"A vehicle decreases its speed by
Using the known information creates the graph below.
Step 3: Using the graph above, identify the domain.
Recalling that the domain of a function is the interval of
Compare your answer with the correct one above
A vehicle decreases its speed by miles per hour every five minutes for 45 minutes resulting in a minimum speed of 25 miles per hour. If represents this function, what is the domain of ?
A vehicle decreases its speed by
This particular question is testings one's ability to recognize characteristics of a function in terms of its context. Specifically, it is testing the ability to identify the domain of a function, or in other words, the possible input values that logically and mathematically work for the situation that is described by .
For the purpose of Common Core Standards, "relate the domain of a function to its graph and, where applicable, to the quantitative relationship it describes" falls within the Cluster B of "interpret functions that arise in applications in terms of the context" concept (CCSS.MATH.CONTENT.HSF-IF.B.5).
Knowing the standard and the concept for which it relates to, we can now do the step-by-step process to solve the problem in question.
Step 1: Identify what the question is asking for.
This question is asking to find the domain, possible x values that make sense for this situation .
Step 2: Use the information that describes and create a graph that could possibly fit.
Let us identify the known information of the function.
is in intervals of "miles per every five minutes" and goes from zero to 45 minutes. Therefore to find the units that the -axis will have, convert 45 minutes into intervals of five minutes.

The minimum speed is 25 miles per hour. Therefore, the -axis spans from 25 to a higher number .
Since the question states, "A vehicle decreases its speed by miles per hour every five minutes for 45 minutes", a linear relationship being time and speed is assumed.
Using the known information creates the graph below.

Step 3: Using the graph above, identify the domain.
Recalling that the domain of a function is the interval of values that result in a real output that lies in the range of the function. In mathematical terms,
 .
.
This particular question is testings one's ability to recognize characteristics of a function in terms of its context. Specifically, it is testing the ability to identify the domain of a function, or in other words, the possible input values that logically and mathematically work for the situation that is described by
For the purpose of Common Core Standards, "relate the domain of a function to its graph and, where applicable, to the quantitative relationship it describes" falls within the Cluster B of "interpret functions that arise in applications in terms of the context" concept (CCSS.MATH.CONTENT.HSF-IF.B.5).
Knowing the standard and the concept for which it relates to, we can now do the step-by-step process to solve the problem in question.
Step 1: Identify what the question is asking for.
This question is asking to find the domain, possible x values that make sense for this situation
Step 2: Use the information that describes
Let us identify the known information of the function.
The minimum speed is 25 miles per hour. Therefore, the
Since the question states, "A vehicle decreases its speed by
Using the known information creates the graph below.
Step 3: Using the graph above, identify the domain.
Recalling that the domain of a function is the interval of
Compare your answer with the correct one above

A vehicle starts to increase its speed after 10 minutes at a rate of miles per hour every five minutes for 80 minutes resulting in a maximum speed of 12 miles per hour. If represents this function, what is the domain of ?
A vehicle starts to increase its speed after 10 minutes at a rate of
This particular question is testings one's ability to recognize characteristics of a function in terms of its context. Specifically, it is testing the ability to identify the domain of a function, or in other words, the possible input values that logically and mathematically work for the situation that is described by .
For the purpose of Common Core Standards, "relate the domain of a function to its graph and, where applicable, to the quantitative relationship it describes" falls within the Cluster B of "interpret functions that arise in applications in terms of the context" concept (CCSS.MATH.CONTENT.HSF-IF.B.5).
Knowing the standard and the concept for which it relates to, we can now do the step-by-step process to solve the problem in question.
Step 1: Identify what the question is asking for.
This question is asking to find the domain, possible x values that make sense for this situation .
Step 2: Use the information that describes and create a graph that could possibly fit.
Let us identify the known information of the function.
is in intervals of "miles per every five minutes" and goes from zero to 80 minutes. Therefore to find the units that the -axis will have, convert 80 into intervals of five minutes.

The maximum speed is 12 miles per hour. Therefore, the -axis spans from zero to 12.
At some value the function reaches a maximum value of,
=12") .
.
Since the question states, "A vehicle increases its speed by miles per hour every five minutes for 80 minutes", a linear relationship being time and speed is assumed.
Using the known information creates the graph below.
Step 3: Using the graph above, identify the domain.
Recalling that the domain of a function is the interval of values that result in a real output that lies in the range of the function. In mathematical terms,
 .
.
This particular question is testings one's ability to recognize characteristics of a function in terms of its context. Specifically, it is testing the ability to identify the domain of a function, or in other words, the possible input values that logically and mathematically work for the situation that is described by
For the purpose of Common Core Standards, "relate the domain of a function to its graph and, where applicable, to the quantitative relationship it describes" falls within the Cluster B of "interpret functions that arise in applications in terms of the context" concept (CCSS.MATH.CONTENT.HSF-IF.B.5).
Knowing the standard and the concept for which it relates to, we can now do the step-by-step process to solve the problem in question.
Step 1: Identify what the question is asking for.
This question is asking to find the domain, possible x values that make sense for this situation
Step 2: Use the information that describes
Let us identify the known information of the function.
The maximum speed is 12 miles per hour. Therefore, the
At some value
Since the question states, "A vehicle increases its speed by
Using the known information creates the graph below.
Step 3: Using the graph above, identify the domain.
Recalling that the domain of a function is the interval of
Compare your answer with the correct one above

A vehicle decrease its speed at a rate of miles per hour every five minutes for 90 minutes resulting in a minimum speed of 5 miles per hour. If represents this function, what is the domain of ?
A vehicle decrease its speed at a rate of
This particular question is testings one's ability to recognize characteristics of a function in terms of its context. Specifically, it is testing the ability to identify the domain of a function, or in other words, the possible input values that logically and mathematically work for the situation that is described by .
For the purpose of Common Core Standards, "relate the domain of a function to its graph and, where applicable, to the quantitative relationship it describes" falls within the Cluster B of "interpret functions that arise in applications in terms of the context" concept (CCSS.MATH.CONTENT.HSF-IF.B.5).
Knowing the standard and the concept for which it relates to, we can now do the step-by-step process to solve the problem in question.
Step 1: Identify what the question is asking for.
This question is asking to find the domain, possible x values that make sense for this situation .
Step 2: Use the information that describes and create a graph that could possibly fit.
Let us identify the known information of the function.
is in intervals of "miles per every five minutes" and goes from zero to 90 minutes. Therefore to find the units that the -axis will have, convert 90 minutes into intervals of five minutes.

Therefore, the -axis spans from zero to 5.
At some value the function reaches a maximum value of,
=5") .
.
Since the question states, "A vehicle decreases its speed by miles per hour every five minutes for 90 minutes", a linear relationship being time and speed is assumed.
Using the known information creates the graph below.
Step 3: Using the graph above, identify the domain.
Recalling that the domain of a function is the interval of values that result in a real output that lies in the range of the function. In mathematical terms,
 .
.
This particular question is testings one's ability to recognize characteristics of a function in terms of its context. Specifically, it is testing the ability to identify the domain of a function, or in other words, the possible input values that logically and mathematically work for the situation that is described by
For the purpose of Common Core Standards, "relate the domain of a function to its graph and, where applicable, to the quantitative relationship it describes" falls within the Cluster B of "interpret functions that arise in applications in terms of the context" concept (CCSS.MATH.CONTENT.HSF-IF.B.5).
Knowing the standard and the concept for which it relates to, we can now do the step-by-step process to solve the problem in question.
Step 1: Identify what the question is asking for.
This question is asking to find the domain, possible x values that make sense for this situation
Step 2: Use the information that describes
Let us identify the known information of the function.
Therefore, the
At some value
Since the question states, "A vehicle decreases its speed by
Using the known information creates the graph below.
Step 3: Using the graph above, identify the domain.
Recalling that the domain of a function is the interval of
Compare your answer with the correct one above

A vehicle starts to increase its speed after 25 minutes at a rate of miles per hour every five minutes for 125 minutes resulting in a maximum speed of 35 miles per hour. If represents this function, what is the domain of ?
A vehicle starts to increase its speed after 25 minutes at a rate of
This particular question is testings one's ability to recognize characteristics of a function in terms of its context. Specifically, it is testing the ability to identify the domain of a function, or in other words, the possible input values that logically and mathematically work for the situation that is described by .
For the purpose of Common Core Standards, "relate the domain of a function to its graph and, where applicable, to the quantitative relationship it describes" falls within the Cluster B of "interpret functions that arise in applications in terms of the context" concept (CCSS.MATH.CONTENT.HSF-IF.B.5).
Knowing the standard and the concept for which it relates to, we can now do the step-by-step process to solve the problem in question.
Step 1: Identify what the question is asking for.
This question is asking to find the domain, possible x values that make sense for this situation .
Step 2: Use the information that describes and create a graph that could possibly fit.
Let us identify the known information of the function.
is in intervals of "miles per every five minutes" and goes from zero to 125 minutes. Therefore to find the units that the -axis will have, convert 125 minutes into intervals of five minutes.

Since the question states, "A vehicle starts to increase its speed after 25 minutes at a rate of miles per hour every five minutes for 125 minutes", a linear relationship being time and speed is assumed.
Using the known information creates the graph below.
Step 3: Using the graph above, identify the domain.
Recalling that the domain of a function is the interval of values that result in a real output that lies in the range of the function. In mathematical terms,
 .
.
This particular question is testings one's ability to recognize characteristics of a function in terms of its context. Specifically, it is testing the ability to identify the domain of a function, or in other words, the possible input values that logically and mathematically work for the situation that is described by
For the purpose of Common Core Standards, "relate the domain of a function to its graph and, where applicable, to the quantitative relationship it describes" falls within the Cluster B of "interpret functions that arise in applications in terms of the context" concept (CCSS.MATH.CONTENT.HSF-IF.B.5).
Knowing the standard and the concept for which it relates to, we can now do the step-by-step process to solve the problem in question.
Step 1: Identify what the question is asking for.
This question is asking to find the domain, possible x values that make sense for this situation
Step 2: Use the information that describes
Let us identify the known information of the function.
Since the question states, "A vehicle starts to increase its speed after 25 minutes at a rate of
Using the known information creates the graph below.
Step 3: Using the graph above, identify the domain.
Recalling that the domain of a function is the interval of
Compare your answer with the correct one above

A vehicle starts to increase its speed after 50 minutes at a rate of miles per hour every five minutes for 175 minutes resulting in a maximum speed of 45 miles per hour. If represents this function, what is the domain of ?
A vehicle starts to increase its speed after 50 minutes at a rate of
This particular question is testings one's ability to recognize characteristics of a function in terms of its context. Specifically, it is testing the ability to identify the domain of a function, or in other words, the possible input values that logically and mathematically work for the situation that is described by .
For the purpose of Common Core Standards, "relate the domain of a function to its graph and, where applicable, to the quantitative relationship it describes" falls within the Cluster B of "interpret functions that arise in applications in terms of the context" concept (CCSS.MATH.CONTENT.HSF-IF.B.5).
Knowing the standard and the concept for which it relates to, we can now do the step-by-step process to solve the problem in question.
Step 1: Identify what the question is asking for.
This question is asking to find the domain, possible x values that make sense for this situation .
Step 2: Use the information that describes and create a graph that could possibly fit.
Let us identify the known information of the function.
is in intervals of "miles per every five minutes" and goes from zero to 175 minutes. Therefore to find the units that the -axis will have, convert 175 minutes into intervals of five minutes.

The maximum speed is 45 miles per hour. Therefore, the -axis spans from zero to 45.
At some value the function reaches a maximum value of,
=45") .
.
Since the question states, "A vehicle starts to increase its speed after 50 minutes at a rate of miles per hour every five minutes for 175 minutes resulting in a maximum speed of 45 miles per hour", a linear relationship being time and speed is assumed.
Using the known information creates the graph below.
Step 3: Using the graph above, identify the domain.
Recalling that the domain of a function is the interval of values that result in a real output that lies in the range of the function. In mathematical terms,
 .
.
This particular question is testings one's ability to recognize characteristics of a function in terms of its context. Specifically, it is testing the ability to identify the domain of a function, or in other words, the possible input values that logically and mathematically work for the situation that is described by
For the purpose of Common Core Standards, "relate the domain of a function to its graph and, where applicable, to the quantitative relationship it describes" falls within the Cluster B of "interpret functions that arise in applications in terms of the context" concept (CCSS.MATH.CONTENT.HSF-IF.B.5).
Knowing the standard and the concept for which it relates to, we can now do the step-by-step process to solve the problem in question.
Step 1: Identify what the question is asking for.
This question is asking to find the domain, possible x values that make sense for this situation
Step 2: Use the information that describes
Let us identify the known information of the function.
The maximum speed is 45 miles per hour. Therefore, the
At some value
Since the question states, "A vehicle starts to increase its speed after 50 minutes at a rate of
Using the known information creates the graph below.
Step 3: Using the graph above, identify the domain.
Recalling that the domain of a function is the interval of
Compare your answer with the correct one above

A vehicle decrease its speed at a rate of miles per hour every five minutes for 225 minutes resulting in a minimum speed of 40 miles per hour. If represents this function, what is the domain of ?
A vehicle decrease its speed at a rate of
This particular question is testings one's ability to recognize characteristics of a function in terms of its context. Specifically, it is testing the ability to identify the domain of a function, or in other words, the possible input values that logically and mathematically work for the situation that is described by .
For the purpose of Common Core Standards, "relate the domain of a function to its graph and, where applicable, to the quantitative relationship it describes" falls within the Cluster B of "interpret functions that arise in applications in terms of the context" concept (CCSS.MATH.CONTENT.HSF-IF.B.5).
Knowing the standard and the concept for which it relates to, we can now do the step-by-step process to solve the problem in question.
Step 1: Identify what the question is asking for.
This question is asking to find the domain, possible x values that make sense for this situation .
Step 2: Use the information that describes and create a graph that could possibly fit.
Let us identify the known information of the function.
is in intervals of "miles per every five minutes" and goes from zero to 225 minutes. Therefore to find the units that the -axis will have, convert 225 minutes into intervals of five minutes.

Since the question states, "A vehicle decreases its speed by miles per hour every five minutes for 90 minutes", a linear relationship being time and speed is assumed.
Using the known information creates the graph below.
Step 3: Using the graph above, identify the domain.
Recalling that the domain of a function is the interval of values that result in a real output that lies in the range of the function. In mathematical terms,
 .
.
This particular question is testings one's ability to recognize characteristics of a function in terms of its context. Specifically, it is testing the ability to identify the domain of a function, or in other words, the possible input values that logically and mathematically work for the situation that is described by
For the purpose of Common Core Standards, "relate the domain of a function to its graph and, where applicable, to the quantitative relationship it describes" falls within the Cluster B of "interpret functions that arise in applications in terms of the context" concept (CCSS.MATH.CONTENT.HSF-IF.B.5).
Knowing the standard and the concept for which it relates to, we can now do the step-by-step process to solve the problem in question.
Step 1: Identify what the question is asking for.
This question is asking to find the domain, possible x values that make sense for this situation
Step 2: Use the information that describes
Let us identify the known information of the function.
Since the question states, "A vehicle decreases its speed by
Using the known information creates the graph below.
Step 3: Using the graph above, identify the domain.
Recalling that the domain of a function is the interval of
Compare your answer with the correct one above

A vehicle starts to increase its speed after 100 minutes at a rate of miles per hour every five minutes for 200 minutes resulting in a maximum speed near 80 miles per hour. If represents this function, what is the domain of ?
A vehicle starts to increase its speed after 100 minutes at a rate of
This particular question is testings one's ability to recognize characteristics of a function in terms of its context. Specifically, it is testing the ability to identify the domain of a function, or in other words, the possible input values that logically and mathematically work for the situation that is described by .
For the purpose of Common Core Standards, "relate the domain of a function to its graph and, where applicable, to the quantitative relationship it describes" falls within the Cluster B of "interpret functions that arise in applications in terms of the context" concept (CCSS.MATH.CONTENT.HSF-IF.B.5).
Knowing the standard and the concept for which it relates to, we can now do the step-by-step process to solve the problem in question.
Step 1: Identify what the question is asking for.
This question is asking to find the domain, possible x values that make sense for this situation .
Step 2: Use the information that describes and create a graph that could possibly fit.
Let us identify the known information of the function.
is in intervals of "miles per every five minutes" and goes from zero to 200 minutes. Therefore to find the units that the -axis will have, convert 200 minutes into intervals of five minutes.

Since the question states, "A vehicle starts to increase its speed after 100 minutes at a rate of miles per hour every five minutes for 200 minutes", a linear relationship being time and speed is assumed.
Using the known information creates the graph below.
Step 3: Using the graph above, identify the domain.
Recalling that the domain of a function is the interval of values that result in a real output that lies in the range of the function. In mathematical terms,
 .
.
This particular question is testings one's ability to recognize characteristics of a function in terms of its context. Specifically, it is testing the ability to identify the domain of a function, or in other words, the possible input values that logically and mathematically work for the situation that is described by
For the purpose of Common Core Standards, "relate the domain of a function to its graph and, where applicable, to the quantitative relationship it describes" falls within the Cluster B of "interpret functions that arise in applications in terms of the context" concept (CCSS.MATH.CONTENT.HSF-IF.B.5).
Knowing the standard and the concept for which it relates to, we can now do the step-by-step process to solve the problem in question.
Step 1: Identify what the question is asking for.
This question is asking to find the domain, possible x values that make sense for this situation
Step 2: Use the information that describes
Let us identify the known information of the function.
Since the question states, "A vehicle starts to increase its speed after 100 minutes at a rate of
Using the known information creates the graph below.
Step 3: Using the graph above, identify the domain.
Recalling that the domain of a function is the interval of
Compare your answer with the correct one above

A vehicle decrease its speed after 75 minutes at a rate of miles per hour every five minutes for 225 minutes resulting in a minimum speed of 10 miles per hour. If represents this function, what is the domain of ?
A vehicle decrease its speed after 75 minutes at a rate of
This particular question is testings one's ability to recognize characteristics of a function in terms of its context. Specifically, it is testing the ability to identify the domain of a function, or in other words, the possible input values that logically and mathematically work for the situation that is described by .
For the purpose of Common Core Standards, "relate the domain of a function to its graph and, where applicable, to the quantitative relationship it describes" falls within the Cluster B of "interpret functions that arise in applications in terms of the context" concept (CCSS.MATH.CONTENT.HSF-IF.B.5).
Knowing the standard and the concept for which it relates to, we can now do the step-by-step process to solve the problem in question.
Step 1: Identify what the question is asking for.
This question is asking to find the domain, possible x values that make sense for this situation .
Step 2: Use the information that describes and create a graph that could possibly fit.
Let us identify the known information of the function.
is in intervals of "miles per every five minutes" and goes from zero to 225 minutes. Therefore to find the units that the -axis will have, convert 225 minutes into intervals of five minutes.

Since the question states, "A vehicle decrease its speed after 75 minutes at a rate of miles per hour every five minutes for 225 minutes", a linear relationship being time and speed is assumed.
Using the known information creates the graph below.
Step 3: Using the graph above, identify the domain.
Recalling that the domain of a function is the interval of values that result in a real output that lies in the range of the function. In mathematical terms,
 .
.
This particular question is testings one's ability to recognize characteristics of a function in terms of its context. Specifically, it is testing the ability to identify the domain of a function, or in other words, the possible input values that logically and mathematically work for the situation that is described by
For the purpose of Common Core Standards, "relate the domain of a function to its graph and, where applicable, to the quantitative relationship it describes" falls within the Cluster B of "interpret functions that arise in applications in terms of the context" concept (CCSS.MATH.CONTENT.HSF-IF.B.5).
Knowing the standard and the concept for which it relates to, we can now do the step-by-step process to solve the problem in question.
Step 1: Identify what the question is asking for.
This question is asking to find the domain, possible x values that make sense for this situation
Step 2: Use the information that describes
Let us identify the known information of the function.
Since the question states, "A vehicle decrease its speed after 75 minutes at a rate of
Using the known information creates the graph below.
Step 3: Using the graph above, identify the domain.
Recalling that the domain of a function is the interval of
Compare your answer with the correct one above