Statistics & Probability - Common Core: 6th Grade Math
Card 0 of 20
Select the description that best describes the measure of center for a numerical data set.
Select the description that best describes the measure of center for a numerical data set.
By definition, the measure of center for a numerical data set is a value at the center of a data set and summarizes all of the values in a data set with a single number. Algebraically, the most common ways to solve for the measure of center is to solve for the mean or median.
By definition, the measure of center for a numerical data set is a value at the center of a data set and summarizes all of the values in a data set with a single number. Algebraically, the most common ways to solve for the measure of center is to solve for the mean or median.
Compare your answer with the correct one above
Select the description that best describes the measure of variation for a numerical data set.
Select the description that best describes the measure of variation for a numerical data set.
By definition, the measure of variation describes how the data set's values vary with a single number.
By definition, the measure of variation describes how the data set's values vary with a single number.
Compare your answer with the correct one above
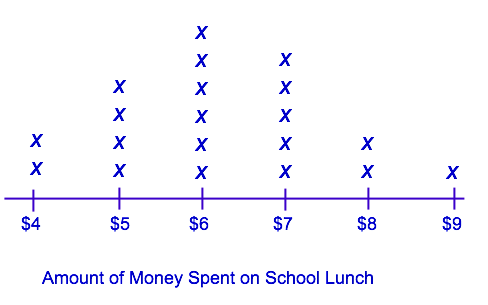
Mr. Sommers wanted to see how much money his students spent on school lunch in a given day. The distribution of this data is shown in the plot provided. Use mean to solve for the center of this distribution.
Mr. Sommers wanted to see how much money his students spent on school lunch in a given day. The distribution of this data is shown in the plot provided. Use mean to solve for the center of this distribution.
In order to solve for the mean, we need to add up all of the money spent on lunch, and then divide by the number of addends in our set:


The center of distribution, using the mean, is 
In order to solve for the mean, we need to add up all of the money spent on lunch, and then divide by the number of addends in our set:
The center of distribution, using the mean, is
Compare your answer with the correct one above
Mr. Sommers wanted to see how much money his students spent on school lunch in a given day. The distribution of this data is shown in the plot provided, with each x representing one student in his class. What is the median amount of money that a student spends on lunch?
Mr. Sommers wanted to see how much money his students spent on school lunch in a given day. The distribution of this data is shown in the plot provided, with each x representing one student in his class. What is the median amount of money that a student spends on lunch?
In order to solve for median, we need to list all of our data points in order from least to greatest:

Next, we want to find the number, or numbers that are in the middle:

The center of distribution, using the median, is 
In order to solve for median, we need to list all of our data points in order from least to greatest:
Next, we want to find the number, or numbers that are in the middle:
The center of distribution, using the median, is
Compare your answer with the correct one above
Mr. Sommers wanted to see how much money his students spent on school lunch in a given day. The distribution of this data is shown in the plot provided. What is the highest amount of money spent on lunch by one of Mr. Sommers's students?
Mr. Sommers wanted to see how much money his students spent on school lunch in a given day. The distribution of this data is shown in the plot provided. What is the highest amount of money spent on lunch by one of Mr. Sommers's students?
The plot shows the amount of money spent on school lunch on a number line.  is the greatest number on the number line, and one student spent
  on lunch; thus,
  is the correct answer.
The plot shows the amount of money spent on school lunch on a number line.
Compare your answer with the correct one above
Mr. Sommers wanted to see how much money his students spent on school lunch in a given day. The distribution of this data is shown in the plot provided. What is the least amount of money spent on lunch by one of Mr. Sommers's students?
Mr. Sommers wanted to see how much money his students spent on school lunch in a given day. The distribution of this data is shown in the plot provided. What is the least amount of money spent on lunch by one of Mr. Sommers's students?
The plot shows the amount of money spent on school lunch on a number line.  is the smallest number on the number line, and two students spent
  on lunch; thus,
  is the correct answer.
The plot shows the amount of money spent on school lunch on a number line.
Compare your answer with the correct one above
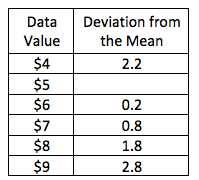
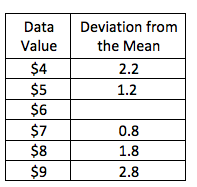
Mr. Sommers wanted to see how much money his students spent on school lunch in a given day. The distribution of this data is shown in the plot provided. Use the information provided in the plot to fill in the blank of the table.
Mr. Sommers wanted to see how much money his students spent on school lunch in a given day. The distribution of this data is shown in the plot provided. Use the information provided in the plot to fill in the blank of the table.
The table shows how far away each data value is from the mean. In order to solve for the missing piece of the table, we first need to solve for the mean:
In order to solve for the mean, we need to add up all of the money spent on lunch, and then divide by the number of addends in our set:


The mean for this data set is 
Next, we can subtract the data value from the mean to find the deviation from the mean:

The correct answer is 
The table shows how far away each data value is from the mean. In order to solve for the missing piece of the table, we first need to solve for the mean:
In order to solve for the mean, we need to add up all of the money spent on lunch, and then divide by the number of addends in our set:
The mean for this data set is
Next, we can subtract the data value from the mean to find the deviation from the mean:
The correct answer is
Compare your answer with the correct one above
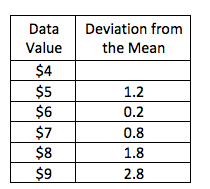
Mr. Sommers wanted to see how much money his students spent on school lunch in a given day. The distribution of this data is shown in the plot provided. Use the information provided in the plot to fill in the blank of the table.
Mr. Sommers wanted to see how much money his students spent on school lunch in a given day. The distribution of this data is shown in the plot provided. Use the information provided in the plot to fill in the blank of the table.
The table shows how far away each data value is from the mean. In order to solve for the missing piece of the table, we first need to solve for the mean:
In order to solve for the mean, we need to add up all of the money spent on lunch, and then divide by the number of addends in our set:


The mean for this data set is 
Next, we can subtract the data value from the mean to find the deviation from the mean:

The correct answer is 
The table shows how far away each data value is from the mean. In order to solve for the missing piece of the table, we first need to solve for the mean:
In order to solve for the mean, we need to add up all of the money spent on lunch, and then divide by the number of addends in our set:
The mean for this data set is
Next, we can subtract the data value from the mean to find the deviation from the mean:
The correct answer is
Compare your answer with the correct one above
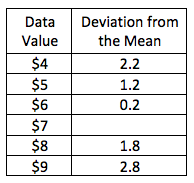
Mr. Sommers wanted to see how much money his students spent on school lunch in a given day. The distribution of this data is shown in the plot provided. Use the information provided in the plot to fill in the blank of the table.
Mr. Sommers wanted to see how much money his students spent on school lunch in a given day. The distribution of this data is shown in the plot provided. Use the information provided in the plot to fill in the blank of the table.
The table shows how far away each data value is from the mean. In order to solve for the missing piece of the table, we first need to solve for the mean:
In order to solve for the mean, we need to add up all of the money spent on lunch, and then divide by the number of addends in our set:


The mean for this data set is 
Next, we can subtract the data value from the mean to find the deviation from the mean:

The correct answer is 
The table shows how far away each data value is from the mean. In order to solve for the missing piece of the table, we first need to solve for the mean:
In order to solve for the mean, we need to add up all of the money spent on lunch, and then divide by the number of addends in our set:
The mean for this data set is
Next, we can subtract the data value from the mean to find the deviation from the mean:
The correct answer is
Compare your answer with the correct one above
Mr. Sommers wanted to see how much money his students spent on school lunch in a given day. The distribution of this data is shown in the plot provided. Use the information provided in the plot to fill in the blank of the table.

Mr. Sommers wanted to see how much money his students spent on school lunch in a given day. The distribution of this data is shown in the plot provided. Use the information provided in the plot to fill in the blank of the table.
The table shows how far away each data value is from the mean. In order to solve for the missing piece of the table, we first need to solve for the mean:
In order to solve for the mean, we need to add up all of the money spent on lunch, and then divide by the number of addends in our set:
The mean for this data set is
Next, we can subtract the data value from the mean to find the deviation from the mean:

The correct answer is 
The table shows how far away each data value is from the mean. In order to solve for the missing piece of the table, we first need to solve for the mean:
In order to solve for the mean, we need to add up all of the money spent on lunch, and then divide by the number of addends in our set:
The mean for this data set is
Next, we can subtract the data value from the mean to find the deviation from the mean:
The correct answer is
Compare your answer with the correct one above
Mr. Sommers wanted to see how much money his students spent on school lunch in a given day. The distribution of this data is shown in the plot provided. Use the information provided in the plot to fill in the blank of the table.
Mr. Sommers wanted to see how much money his students spent on school lunch in a given day. The distribution of this data is shown in the plot provided. Use the information provided in the plot to fill in the blank of the table.
The table shows how far away each data value is from the mean. In order to solve for the missing piece of the table, we first need to solve for the mean:
In order to solve for the mean, we need to add up all of the money spent on lunch, and then divide by the number of addends in our set:
The mean for this data set is
Next, we can subtract the data value from the mean to find the deviation from the mean:

The correct answer is 
The table shows how far away each data value is from the mean. In order to solve for the missing piece of the table, we first need to solve for the mean:
In order to solve for the mean, we need to add up all of the money spent on lunch, and then divide by the number of addends in our set:
The mean for this data set is
Next, we can subtract the data value from the mean to find the deviation from the mean:
The correct answer is
Compare your answer with the correct one above
Several students from Jones Middle School participated in a  race this weekend. The gym teacher at the school displayed the time, in minutes, it took each student to complete the race in the chart provided. What is the attribute being measured in this chart?
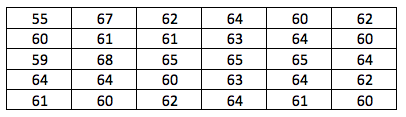
Several students from Jones Middle School participated in a
To answer this question, we need to make sure we've read the text provided in the question:
"Several students from Jones Middle School participated in a  race this weekend. The gym teacher at the school displayed the time, in minutes, it took each student to complete the race in the chart provided. "
Based on the information given, the length of time it took to complete a  race is being measure in the table.
To answer this question, we need to make sure we've read the text provided in the question:
"Several students from Jones Middle School participated in a
Based on the information given, the length of time it took to complete a
Compare your answer with the correct one above
Several students from Jones Middle School participated in a  race this weekend. The gym teacher at the school displayed the time, in minutes, it took each student to complete the race in the chart provided. What is the the unit of measurement in this chart?
Several students from Jones Middle School participated in a
To answer this question, we need to make sure we've read the text provided in the question:
"Several students from Jones Middle School participated in a  race this weekend. The gym teacher at the school displayed the time, in minutes, it took each student to complete the race in the chart provided. "
Based on the information given, the unit of measurement used in this chart is minutes.
To answer this question, we need to make sure we've read the text provided in the question:
"Several students from Jones Middle School participated in a
Based on the information given, the unit of measurement used in this chart is minutes.
Compare your answer with the correct one above
Several students from Jones Middle School participated in a  race this weekend. The gym teacher at the school displayed the time, in minutes, it took each student to complete the race in the chart provided. How many observations were made?
Several students from Jones Middle School participated in a
The number of observations made represents the number of students that participated in the race.The chart shows how long it took each student to complete a  race. Each entry in the chart is how long it took each student to complete the race, so we can count up the number of entries to answer this question.
If done correctly, you should have counted  entries; thus,
  students participated in the race.
The number of observations made represents the number of students that participated in the race.The chart shows how long it took each student to complete a
If done correctly, you should have counted
Compare your answer with the correct one above
Wrigley, a chocolate labradoodle, had a litter of puppies. During a veterinary appointment, each of the puppies were weighed, in pounds, and each weight was documented on the chart provided. What is the attribute being measured in this chart?
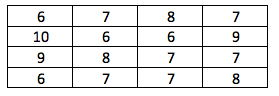
Wrigley, a chocolate labradoodle, had a litter of puppies. During a veterinary appointment, each of the puppies were weighed, in pounds, and each weight was documented on the chart provided. What is the attribute being measured in this chart?
To answer this question, we need to make sure we've read the text provided in the question:
"Wrigley, a chocolate labradoodle, had a litter of puppies. During a veterinary appointment, each of the puppies were weighed, in pounds, and each weight was documented on the chart provided. "
Based on the information given, the weight of each puppy is being measure in the table.
Compare your answer with the correct one above
Wrigley, a chocolate labradoodle, had a litter of puppies. During a veterinary appointment, each of the puppies were weighed, in pounds, and each weight was documented on the chart provided. What is the the unit of measurement in this chart?
Wrigley, a chocolate labradoodle, had a litter of puppies. During a veterinary appointment, each of the puppies were weighed, in pounds, and each weight was documented on the chart provided. What is the the unit of measurement in this chart?
To answer this question, we need to make sure we've read the text provided in the question:
"Wrigley, a chocolate labradoodle, had a litter of puppies. During a veterinary appointment, each of the puppies were weighed, in pounds, and each weight was documented on the chart provided. "
Based on the information given, the unit of measurement used in this chart is pounds.
Compare your answer with the correct one above
Wrigley, a chocolate labradoodle, had a litter of puppies. During a veterinary appointment, each of the puppies were weighed, in pounds, and each weight was documented on the chart provided. How many observations were made?
Wrigley, a chocolate labradoodle, had a litter of puppies. During a veterinary appointment, each of the puppies were weighed, in pounds, and each weight was documented on the chart provided. How many observations were made?
The number of observations made represents the number of puppies in the litter whose weight was recorded.The chart shows the weight of each puppy, so we can count the entires to find the correct answer.
If done correctly, you should have counted  entries; thus,
  puppies's weights were recorded.
The number of observations made represents the number of puppies in the litter whose weight was recorded.The chart shows the weight of each puppy, so we can count the entires to find the correct answer.
If done correctly, you should have counted
Compare your answer with the correct one above
A teacher decided to start tracking the amount of time her students spent on homework each week. The data is displayed in the histogram provided. What is the attribute being measured in this chart?
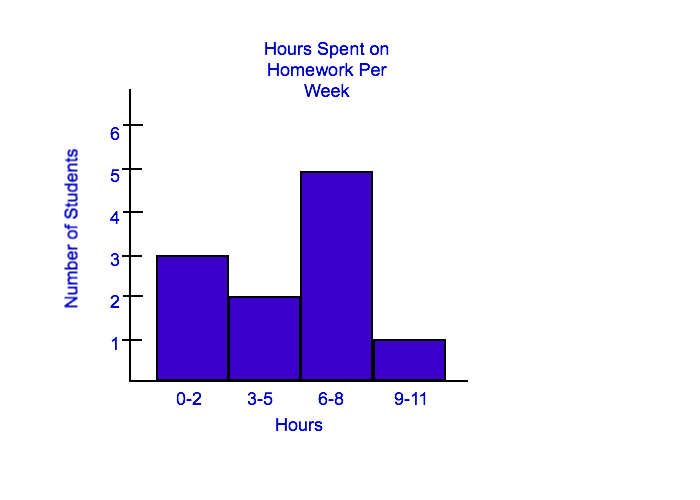
A teacher decided to start tracking the amount of time her students spent on homework each week. The data is displayed in the histogram provided. What is the attribute being measured in this chart?
When we are given a graph or a chart that is labeled with a title, that is generally the best place to start when looking for what is being measured in a chart. This graph is labeled with "Hours Spent on Homework Per Week". Also, when we read the text before the question, we were told that, "a teacher decided to start tracking the amount of time her students spent on homework each week. The data is displayed in the histogram provided"; thus, hours spent on homework per week is the best answer choice.
When we are given a graph or a chart that is labeled with a title, that is generally the best place to start when looking for what is being measured in a chart. This graph is labeled with "Hours Spent on Homework Per Week". Also, when we read the text before the question, we were told that, "a teacher decided to start tracking the amount of time her students spent on homework each week. The data is displayed in the histogram provided"; thus, hours spent on homework per week is the best answer choice.
Compare your answer with the correct one above
A teacher decided to start tracking the amount of time her students spent on homework each week. The data is displayed in the histogram provided. What is the the unit of measurement in this chart?
A teacher decided to start tracking the amount of time her students spent on homework each week. The data is displayed in the histogram provided. What is the the unit of measurement in this chart?
To answer this question correctly, we need to look at the histogram. The teacher is tracking hours that each student spent on homework per week; thus, the correct answer is hours.
To answer this question correctly, we need to look at the histogram. The teacher is tracking hours that each student spent on homework per week; thus, the correct answer is hours.
Compare your answer with the correct one above