Understand Data is Collected to Answer a Question and has a Center, Spread, and Shape: CCSS.Math.Content.6.SP.A.2
Practice Questions
Common Core: 6th Grade Math › Understand Data is Collected to Answer a Question and has a Center, Spread, and Shape: CCSS.Math.Content.6.SP.A.2
Select the description that best describes the distribution of the data shown in the graph.

Mrs. Frame's class counted the number pencils that each student had in his/her desk. The distribution of this data is show in the dot plot provided. What is the most number of pencils that her students found?
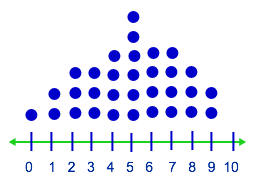
Mrs. Frame's class counted the number pencils that each student had in his/her desk. The distribution of this data is show in the dot plot provided. What is the center of this distribution?
Select the description that best describes the distribution of the data shown in the provided dot plot.
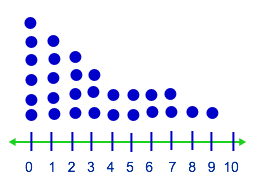
Select the description that best describes the distribution of the data shown in the provided dot plot.
Select the description that best describes the distribution of the data shown in the provided dot plot.
Select the description that best describes the distribution of the data shown in the provided dot plot.
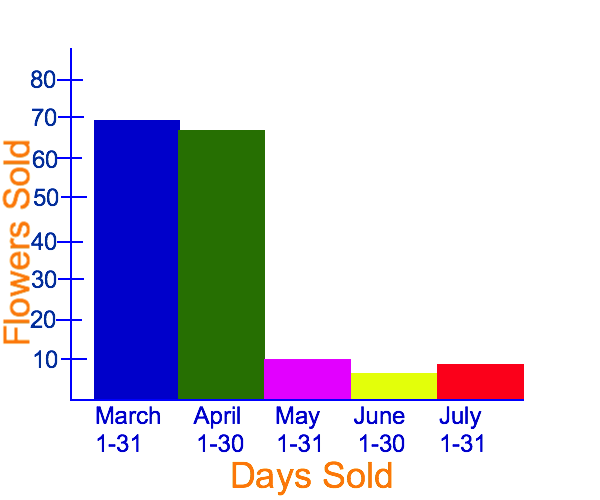
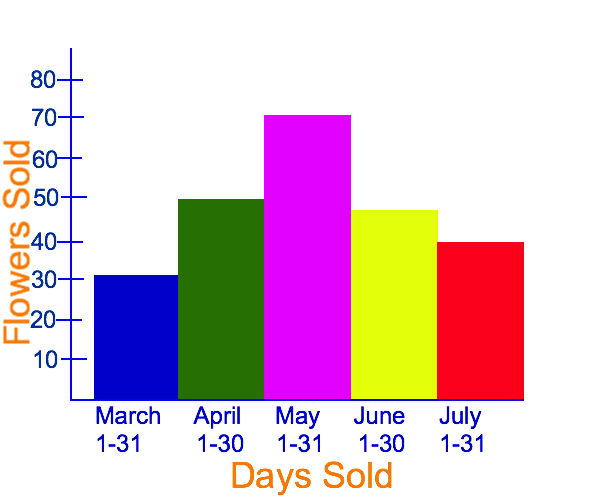
A flower shop counted the number of flowers sold during a 
Mrs. Frame's class counted the number pencils that each student had in his/her desk. The distribution of this data is show in the dot plot provided. How many pencils did most of the students have?
A flower shop counted the number of flowers sold during a 