Compare the Measure of Center and Measure of Variation: CCSS.Math.Content.6.SP.A.3
Practice Questions
Common Core: 6th Grade Math › Compare the Measure of Center and Measure of Variation: CCSS.Math.Content.6.SP.A.3
Select the description that best describes the measure of variation for a numerical data set.
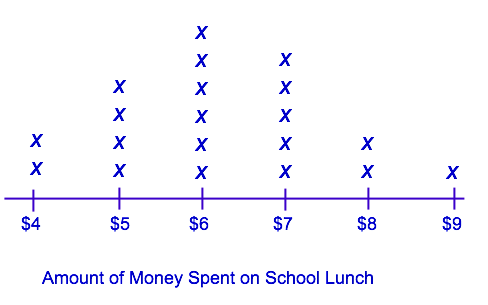
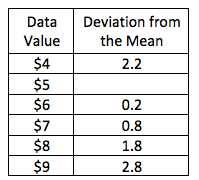
Mr. Sommers wanted to see how much money his students spent on school lunch in a given day. The distribution of this data is shown in the plot provided. Use the information provided in the plot to fill in the blank of the table.
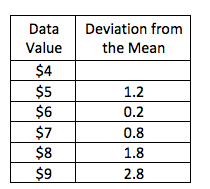
Mr. Sommers wanted to see how much money his students spent on school lunch in a given day. The distribution of this data is shown in the plot provided. Use the information provided in the plot to fill in the blank of the table.
Select the description that best describes the measure of center for a numerical data set.
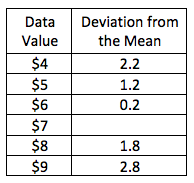
Mr. Sommers wanted to see how much money his students spent on school lunch in a given day. The distribution of this data is shown in the plot provided. Use the information provided in the plot to fill in the blank of the table.
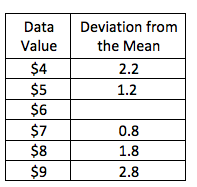
Mr. Sommers wanted to see how much money his students spent on school lunch in a given day. The distribution of this data is shown in the plot provided. Use the information provided in the plot to fill in the blank of the table.
Mr. Sommers wanted to see how much money his students spent on school lunch in a given day. The distribution of this data is shown in the plot provided. What is the least amount of money spent on lunch by one of Mr. Sommers's students?
Mr. Sommers wanted to see how much money his students spent on school lunch in a given day. The distribution of this data is shown in the plot provided. Use the information provided in the plot to fill in the blank of the table.

Mr. Sommers wanted to see how much money his students spent on school lunch in a given day. The distribution of this data is shown in the plot provided. Use mean to solve for the center of this distribution.
Mr. Sommers wanted to see how much money his students spent on school lunch in a given day. The distribution of this data is shown in the plot provided, with each x representing one student in his class. What is the median amount of money that a student spends on lunch?