Make a Line Plot to Display a Data Set of Measurements in Fractions and Solve Problems: CCSS.Math.Content.5.MD.B.2
Practice Questions
Common Core: 5th Grade Math › Make a Line Plot to Display a Data Set of Measurements in Fractions and Solve Problems: CCSS.Math.Content.5.MD.B.2
Mrs. Smith’s class made a line plot to show the amount of sugar that each student consumes in a given day.
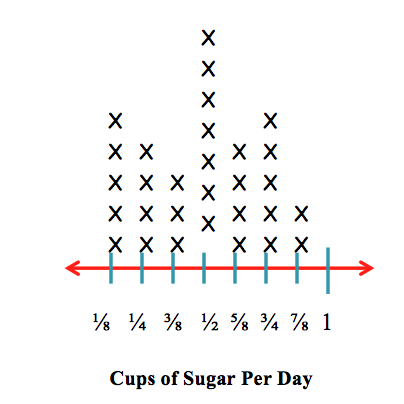
How many students consume 
Mrs. Smith’s class made a line plot to show the amount of sugar that each student has in a given day.
How many students have 

Mrs. Smith’s class made a line plot to show the amount of sugar that each student has in a given day.
How many students have 

Mrs. Smith’s class made a line plot to show the amount of sugar that each student has in a given day.
How many students have 
Mrs. Smith’s class made a line plot to show the amount of sugar that each student has in a given day.
How many students have 
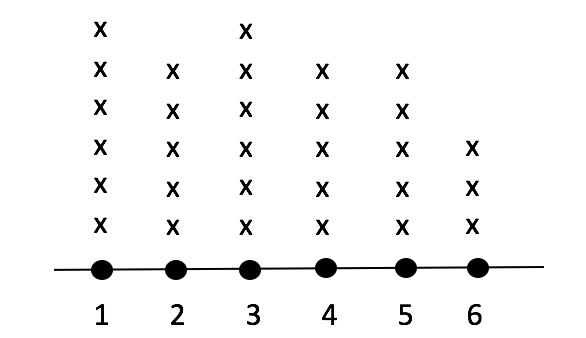
The line chart shows how many books each student in Mrs. Smith's class read this week. How many students are in Mrs. Smith's class?
Mrs. Smith’s class made a line plot to show the amount of sugar that each student has in a given day.
How many students have 
Mrs. Smith’s class made a line plot to show the amount of sugar that each student has in a given day.
How many students have 
Mrs. Smith’s class made a line plot to show the amount of sugar that each student has in a given day.
How many students have 
Mrs. Smith’s class made a line plot to show the amount of sugar that each student consumes in a given day.
How many students consume 