Draw Picture and Bar Graphs to Represent a Data Set: CCSS.Math.Content.2.MD.D.10
Practice Questions
Common Core: 2nd Grade Math › Draw Picture and Bar Graphs to Represent a Data Set: CCSS.Math.Content.2.MD.D.10
Melissa's class made a chart to display her and her classmates' favorite sports.
Use the graph below to answer the question.

Based on the graph, how many people are in Melissa's class?
Melissa's class made a chart to display her and her classmates' favorite sports.
Use the graph below to answer the question.
How many more people favor cheerleading than baseball?
Mr. Ray's class created a bar graph to show how many stuffed animals each student has at home. According to the graph, how many students have one stuffed animal?

Mr. Shine wants to do something different on Fridays, so he is going to add a subject to his class that he will teach every Friday. The results are shown in the table below.
Use the graph below to help answer the question.

What is the label of the x-axis?
Mrs. Ryan's class had their class election today for their class president. The results are displayed in the chart below.
Use the graph below to help answer the question.
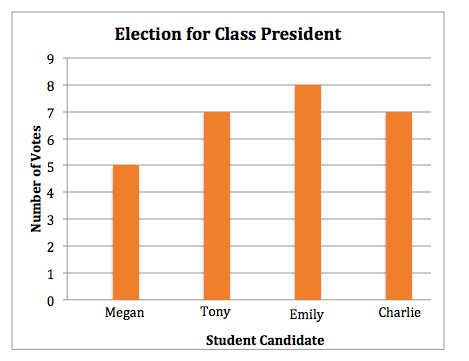
How many people voted for Megan?
Mr. Ray's class created a bar graph to show the number of stuffed animals each student has at home.
How many students have 
Kate's class is going to plant flowers outside of their class window. To help decide what flower to plant, her teacher took a class vote.
Use the graph below to help answer the question.
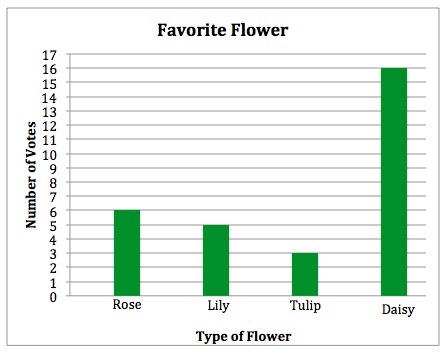
What is the label of the y-axis?
Melissa's class made a chart to display her and her classmates' favorite sports.
Use the graph below to answer the question.
If six students change their minds and decide that soccer is actually their favorite sport, how many students would favor soccer?
Dan's class made a chart to display his and his classmates' favorite subjects.
Use the graph below to answer the question.

How many people listed English as their favorite subject?
Miss. West's class made a chart of the pets that they own.
Use the graph below to answer the question.

How many people own a fish?