How to use boxplots to summarize a data set
Practice Questions
AP Statistics › How to use boxplots to summarize a data set
Questions
6
1
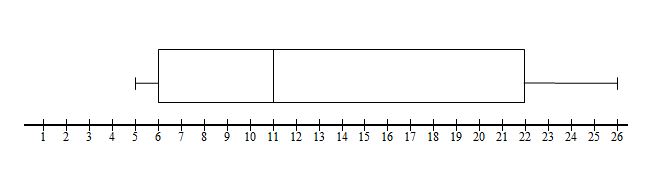
Which data set would be represented by this boxplot?
2
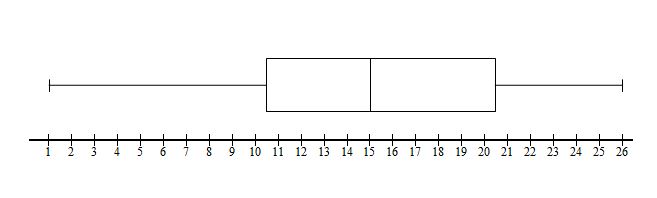
Which of the following is true based on the box plot?
i. The mean is 
ii. The range is approximately 
iii. The IQR is approximatly 
3
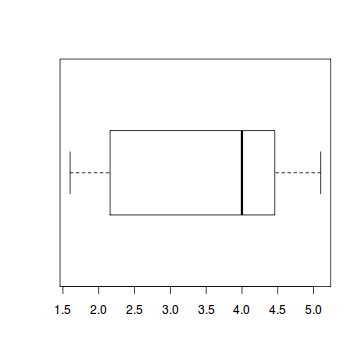
Which statement about the data represented by this boxplot is not true?
4
The horizontal line in the box of the box and whisker plot represents _____________.

5
A distribution has a minimum of 


- The interquartile range is
.
- The distribution is skewed left.
- The range is
.
6
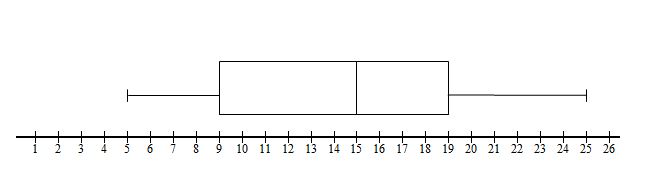
Which data set could be represented by the following boxplot?