How to interpret dotplots
Practice Questions
AP Statistics › How to interpret dotplots
Questions
3
1
A basketball coach wants to determine if a player's height can be used to predict the number of points that player scores in a season. Before using a statistical test to determine the precise relationship of the variables, the coach wants a visual of the data to see if there is likely to be a relationship. Which of the following should the coach create?
2
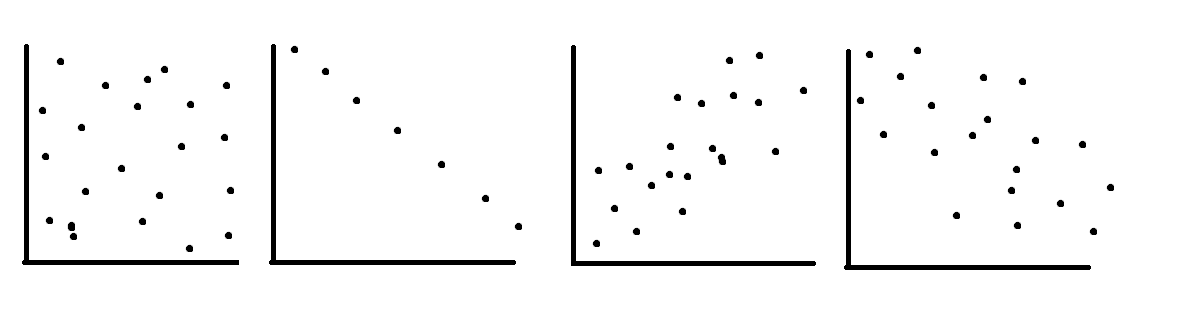
Order the correlation coefficients to fit the order of the following graphs (two coefficients will not be used)


3
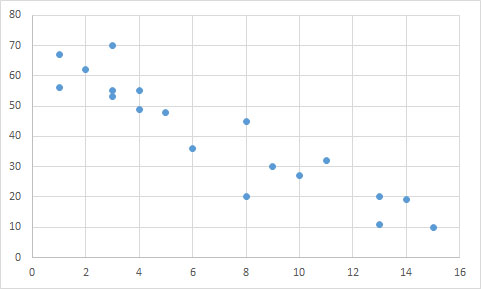
Based on the scatter plot below, is there a correlation between the