Graphing Data
Practice Questions
AP Statistics › Graphing Data

Based on the histogram, which of the following sets of values was most common in the sample?
Based on the histogram, which of the following sets of values was most common in the sample?
A basketball coach wants to determine if a player's height can be used to predict the number of points that player scores in a season. Before using a statistical test to determine the precise relationship of the variables, the coach wants a visual of the data to see if there is likely to be a relationship. Which of the following should the coach create?
A basketball coach wants to determine if a player's height can be used to predict the number of points that player scores in a season. Before using a statistical test to determine the precise relationship of the variables, the coach wants a visual of the data to see if there is likely to be a relationship. Which of the following should the coach create?
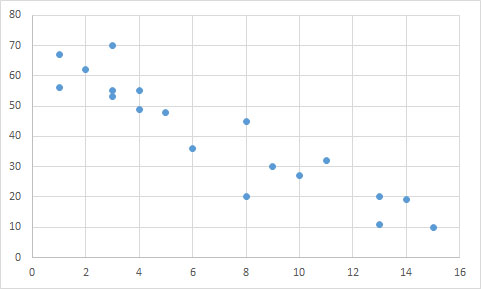
Based on the scatter plot below, is there a correlation between the 

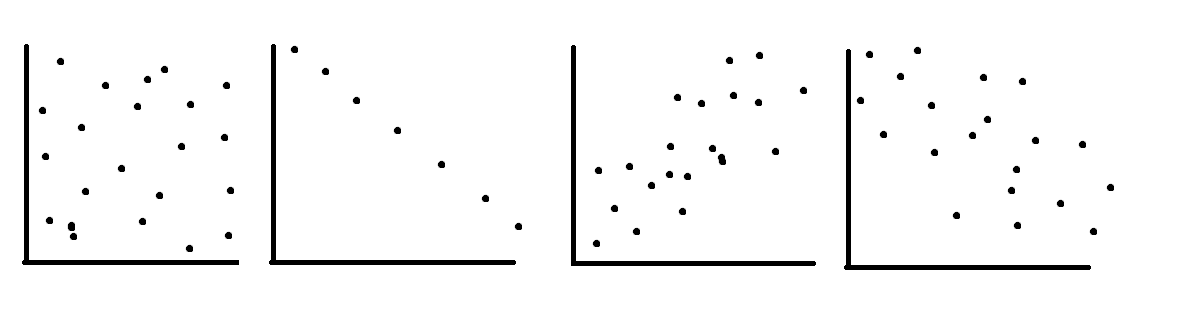
Order the correlation coefficients to fit the order of the following graphs (two coefficients will not be used)


Based on the scatter plot below, is there a correlation between the
Order the correlation coefficients to fit the order of the following graphs (two coefficients will not be used)
Louie collected the following data on sleeping habits of his classmates:
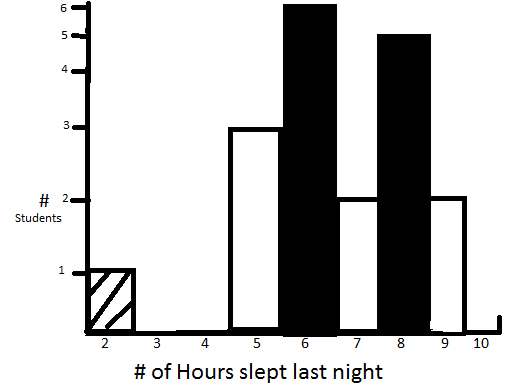
Calculate the median, 1st and 3rd quartile (Q1 and Q3) and mode for the data. There are 19 students in the class.
Louie collects data on the amount of sleep students in his class get.
Below is a graphical representation of the data
Which of the following is/are false about Louie's class' data?
i: the student with 2 hours of sleep is an outlier
ii: without the student with 2 hours of sleep the data is roughly normally distributed
iii: without the student with 2 hours of sleep the data is slightly right skewed
iv: the student with 2 hours of sleep is within 2 standard deviations of the mean