Microeconomics Graphs
Practice Questions
AP Microeconomics › Microeconomics Graphs
Suppose that the price of Good Y increases by 5%. If the quantity supplied of Good Y remains constant, then the price elasticity of supply of Good Y is ________.
Use the following graph for questions 9 - 11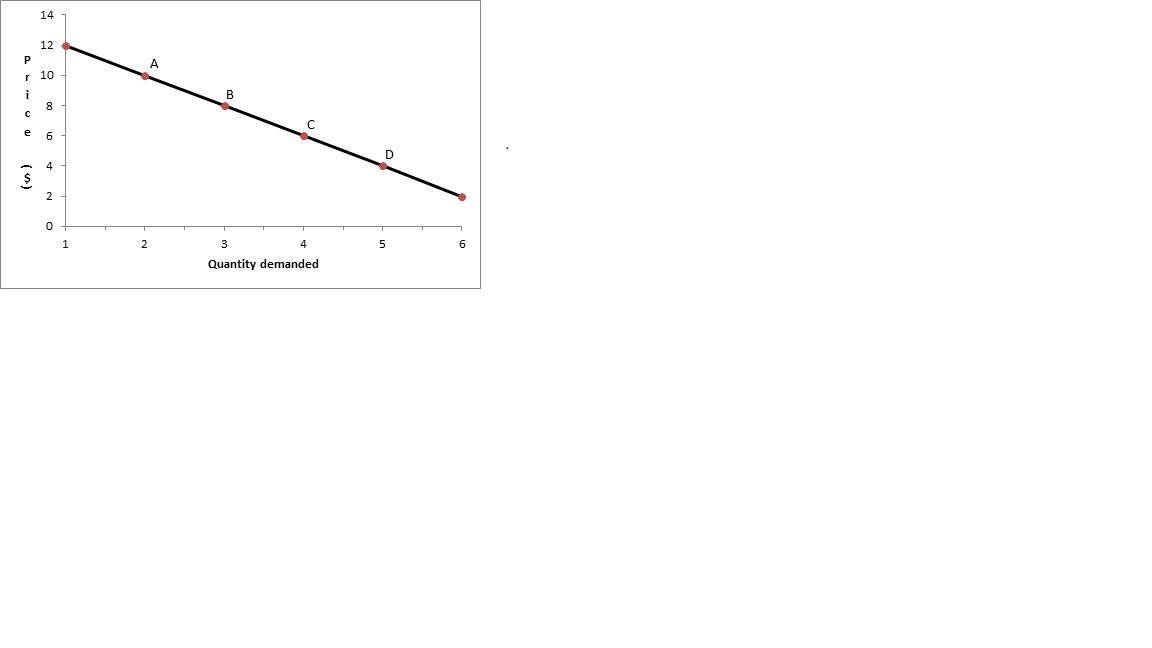
Increasing the price of oranges at point D will result in:
- An increase in total revenue
- A decrease in quantity demanded
- Movement toward a portion of the demand curve that is more elastic
Use the following graph for questions 9 - 11
Increasing the price of oranges at point D will result in:
- An increase in total revenue
- A decrease in quantity demanded
- Movement toward a portion of the demand curve that is more elastic
Which of the following is true of the relationship between the demand curve and the marginal revenue curve in a monopolistic structure?
Suppose that the price of Good Y increases by 5%. If the quantity supplied of Good Y remains constant, then the price elasticity of supply of Good Y is ________.
Use the following graph for questions 9 - 11
Increasing the price of oranges at point D will result in:
- An increase in total revenue
- A decrease in quantity demanded
- Movement toward a portion of the demand curve that is more elastic
Which of the following is true of the relationship between the demand curve and the marginal revenue curve in a monopolistic structure?
Which of the following is true of the relationship between the demand curve and the marginal revenue curve in a monopolistic structure?
Suppose that the price of Good Y increases by 5%. If the quantity supplied of Good Y remains constant, then the price elasticity of supply of Good Y is ________.
Suppose that as result of a 10% increase in income, the quantity demanded of Good X increases by 20%. Which of the following is true?