Statistical Concepts - Algebra II
Card 0 of 20
The number of runs scored per game by a little league baseball team is represented by the following frequency distribution:
Number of Runs Scored Frequency 0 5 1 2 2 7 3 9 4 3 5 0 6 4 7 2 8 2 9 1
Using this frequency table, select the correct answer of m ean runs scored by the little league team (rounded to the nearest hundredth).
The number of runs scored per game by a little league baseball team is represented by the following frequency distribution:
| Number of Runs Scored | Frequency |
|---|---|
| 0 | 5 |
| 1 | 2 |
| 2 | 7 |
| 3 | 9 |
| 4 | 3 |
| 5 | 0 |
| 6 | 4 |
| 7 | 2 |
| 8 | 2 |
| 9 | 1 |
Using this frequency table, select the correct answer of m ean runs scored by the little league team (rounded to the nearest hundredth).
Number of Runs Scored Frequency 0 5 1 2 2 7 3 9 4 3 5 0 6 4 7 2 8 2 9 1
To determine the mean, first the data set should be re-written in sequential order:

The formula to determine mean is:

The mean is approximately 3.37 runs scored per game.
| Number of Runs Scored | Frequency |
|---|---|
| 0 | 5 |
| 1 | 2 |
| 2 | 7 |
| 3 | 9 |
| 4 | 3 |
| 5 | 0 |
| 6 | 4 |
| 7 | 2 |
| 8 | 2 |
| 9 | 1 |
To determine the mean, first the data set should be re-written in sequential order:
The formula to determine mean is:
The mean is approximately 3.37 runs scored per game.
Compare your answer with the correct one above
Thousands of people in the United States were surveyed about their grandparents. This frequency table shows their answer to the question "how many of your grandparents were born outside of the US?
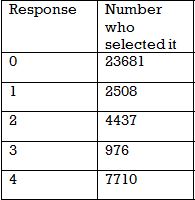
Of the people who had at least one grandparent born outisde of the US, what percent had exactly 3 non-US born grandparents?
Thousands of people in the United States were surveyed about their grandparents. This frequency table shows their answer to the question "how many of your grandparents were born outside of the US?
Of the people who had at least one grandparent born outisde of the US, what percent had exactly 3 non-US born grandparents?
Adding up the total number of grandparents that were born outside the U.S. is our first step in solving this problem.
There are
 people who said they had at least 1 grandparent born outside of the US. Of those, only 976 had exactly 3.
So
 or
or  is the answer.
Adding up the total number of grandparents that were born outside the U.S. is our first step in solving this problem.
There are
So
Compare your answer with the correct one above
Thousands of people in the United States were surveyed about their grandparents. This frequency table shows their answer to the question "how many of your grandparents were born outside of the US?"
Is this data normally distributed?
Thousands of people in the United States were surveyed about their grandparents. This frequency table shows their answer to the question "how many of your grandparents were born outside of the US?"
Is this data normally distributed?
No - normally distributed data has a low frequency of responses at the high and low ends. Also, the majority of the data is in the middle.
In this data set, the majority of people said "0," and the fewest people said "3" which is near the middle of the data. If this data was normally distributed we would have a higher frequency between 1 and 3 and much lower values for 0 and 4.
Compare your answer with the correct one above
What is the correct frequency distribution for this data set?
1 3 5 2 5 2 4 1 5
2 4 1 2 3 5 5 2 3
3 1 4 4 6 2 3 2 4
What is the correct frequency distribution for this data set?
1 3 5 2 5 2 4 1 5
2 4 1 2 3 5 5 2 3
3 1 4 4 6 2 3 2 4
Count the number of times each number appears in the data set.
The number 1 appears 4 times, so the first line is  .
.
Then number 2 appears 7 times, so the next line is  .
.
Continuing in this fashion we see that the numbers 3, 4, and 5 appears 5 times and 6 appears once.
Therefore combining these together we get the following answer:

Count the number of times each number appears in the data set.
The number 1 appears 4 times, so the first line is
Then number 2 appears 7 times, so the next line is
Continuing in this fashion we see that the numbers 3, 4, and 5 appears 5 times and 6 appears once.
Therefore combining these together we get the following answer:
Compare your answer with the correct one above
What is the mean of the data in this frequency table?
# Frequency
1 3
2 4
3 0
4 2
What is the mean of the data in this frequency table?
# Frequency
1 3
2 4
3 0
4 2
The frequency table represents the data set:
1, 1, 1, 2, 2, 2, 2, 4, 4.
The sum is 19 and there are 9 data points, so the mean is
 .
.
The frequency table represents the data set:
1, 1, 1, 2, 2, 2, 2, 4, 4.
The sum is 19 and there are 9 data points, so the mean is
Compare your answer with the correct one above
What is the median of the data in this frequency table?
# Frequency
1 3
2 4
3 0
4 2
What is the median of the data in this frequency table?
# Frequency
1 3
2 4
3 0
4 2
The frequency table represents the data set:
1, 1, 1, 2, 2, 2, 2, 4, 4.
The median is 2 because 4 data points appear before and after the center 2.
The frequency table represents the data set:
1, 1, 1, 2, 2, 2, 2, 4, 4.
The median is 2 because 4 data points appear before and after the center 2.
Compare your answer with the correct one above
Which frequency table has a median of 5? (The first column represents the data points, the second column the frequency)
Which frequency table has a median of 5? (The first column represents the data points, the second column the frequency)
The correct frequency table represents the data set 3, 4, 5, 5, 6, 6, 8.
Since there are 7 data points our median will be the 4th spot which makes the value 5. It occures at the 4th spot because at that spot half the data points are below it while the other half are above it.
The center number of that data set is 5 as required.
Compare your answer with the correct one above
Find the 85th percentile score in the following test results.
{95, 88, 70, 75, 83, 70, 66, 91, 68, 76, 82}
Find the 85th percentile score in the following test results.
{95, 88, 70, 75, 83, 70, 66, 91, 68, 76, 82}
{95, 88, 70, 75, 83, 70, 66, 91, 68, 76, 82}
Arrange the values in numerical order.
{66, 68, 70, 70, 75, 76, 82, 83, 88, 91, 95}
Use the following to calculate percentile-
n")
where  is the percentile and
  is the number of data in the set
11")

This number gives of the location of the 85th percentile in our ordered set. Since it is not a whole number, round up, which will give us 10.
The 85th percentile score is the 10th value in our set, which is 91.
{95, 88, 70, 75, 83, 70, 66, 91, 68, 76, 82}
Arrange the values in numerical order.
{66, 68, 70, 70, 75, 76, 82, 83, 88, 91, 95}
Use the following to calculate percentile-
where
This number gives of the location of the 85th percentile in our ordered set. Since it is not a whole number, round up, which will give us 10.
The 85th percentile score is the 10th value in our set, which is 91.
Compare your answer with the correct one above
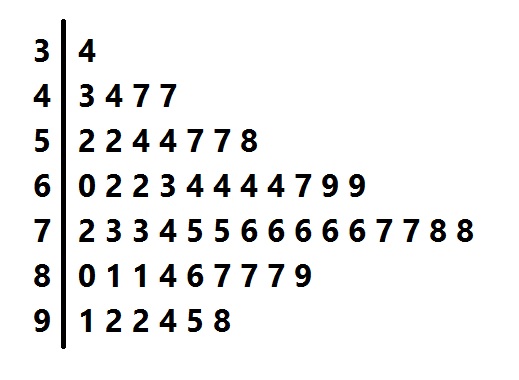
Above is the stem-and-leaf display for a group of test scores. Which of the following scores would come closest to being at the  percentile?
Above is the stem-and-leaf display for a group of test scores. Which of the following scores would come closest to being at the 
The stem-and-leaf display represents 53 scores. The score at the 35th percentile would be the score that is greater than 35% of the scores, or
 scores.
Rounding, we count 19 scores from the bottom:
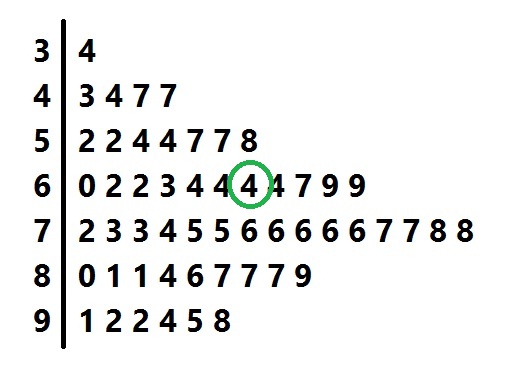
The score represented is 64, which is the correct response.
The stem-and-leaf display represents 53 scores. The score at the 35th percentile would be the score that is greater than 35% of the scores, or
Rounding, we count 19 scores from the bottom:
The score represented is 64, which is the correct response.
Compare your answer with the correct one above
Above is the stem-and-leaf display for a group of test scores. At what percentile would the student who made a score of 86 be?
Above is the stem-and-leaf display for a group of test scores. At what percentile would the student who made a score of 86 be?
The stem-and-leaf display represents 53 scores. The "stems" (or left column) represent the tens digits, and the "leaves" in each row represent units digits, so the scores are

The student who scored an 86 outscored 42 of the students, or

of them. Since percentile is given to the nearest whole number, the correct response is 79.
The stem-and-leaf display represents 53 scores. The "stems" (or left column) represent the tens digits, and the "leaves" in each row represent units digits, so the scores are
The student who scored an 86 outscored 42 of the students, or
of them. Since percentile is given to the nearest whole number, the correct response is 79.
Compare your answer with the correct one above
If a student is ranked eight out of ten in a competition, what is the student's percentile rank?
If a student is ranked eight out of ten in a competition, what is the student's percentile rank?
The formula to calculate a percentile rank is: 
where  represents total of scores below the rank, and
  is the total number of competitors.


Substitute the values into the formula.

The formula to calculate a percentile rank is:
where
Substitute the values into the formula.
Compare your answer with the correct one above
The times for a six-mile race are shown below.
Sean:  hours
hours
Ankur:  hours
hours
Sarah:  hours
hours
Fred:  hours
hours
Ron:  hours
hours
Jareth:  hours
hours
Determine which percentile Sean's time is in.
The times for a six-mile race are shown below.
Sean:
Ankur:
Sarah:
Fred:
Ron:
Jareth:
Determine which percentile Sean's time is in.
First arrange the runners in order of fastest to slowest times:
Ron
Sarah
Jareth
Sean
Ankur
Fred
There are six runners so there will be six different percentiles, each seperated by  percent. A person's percentile refers to which percentage of times are below that person's time. For example, Ron's time is better than
  percent of all runners, so he is in the
  rd percentile.
Then each runner is in the following percentiles:
Ron -  rd
rd
Sarah -  th
th
Jareth -  th
th
Sean -  rd
rd
Ankur -  th
th
Fred -  th
th
As you can see, Sean is in the  rd percentile.
First arrange the runners in order of fastest to slowest times:
Ron
Sarah
Jareth
Sean
Ankur
Fred
There are six runners so there will be six different percentiles, each seperated by
Then each runner is in the following percentiles:
Ron -
Sarah -
Jareth -
Sean -
Ankur -
Fred -
As you can see, Sean is in the
Compare your answer with the correct one above
In a litter of nine kittens, the only orange kitten weighs more than three in the litter, and less than the other remaining five.
What is the percentile of the orange kitten's weight in comparison to the litter?
In a litter of nine kittens, the only orange kitten weighs more than three in the litter, and less than the other remaining five.
What is the percentile of the orange kitten's weight in comparison to the litter?
The percentile is equal to how many items in the set are equal to or less than the one in question divided by the total number of items in the set.
Because there are four items equal to or less than the orange kitten's weight and there are nine items total in the set, the percentile is equal to
 or
or 
The percentile is equal to how many items in the set are equal to or less than the one in question divided by the total number of items in the set.
Because there are four items equal to or less than the orange kitten's weight and there are nine items total in the set, the percentile is equal to
Compare your answer with the correct one above
98, 99, 99, 100, 101, 102, 104, 104, 105, 105, 107, 110, 112, 112
For the above data set, 102 is in what percentile?
98, 99, 99, 100, 101, 102, 104, 104, 105, 105, 107, 110, 112, 112
For the above data set, 102 is in what percentile?
In the data set, 102 is the 6th data point listed. There are 14 data points total. This means that  % of the data is at or below 102. That's approximately the 43rd percentile.
In the data set, 102 is the 6th data point listed. There are 14 data points total. This means that
Compare your answer with the correct one above
98, 99, 99, 100, 101, 102, 104, 104, 105, 105, 107, 110, 112, 112
For the above data set, 110 is in what percentile?
98, 99, 99, 100, 101, 102, 104, 104, 105, 105, 107, 110, 112, 112
For the above data set, 110 is in what percentile?
The number 110 is the 12th in the list of 14 data points. That means that  %. Since about 86% of the data points are at or below 110, it's in the 86th percentile.
The number 110 is the 12th in the list of 14 data points. That means that
Compare your answer with the correct one above
Given the following set of data, what is twice the interquartile range?

Given the following set of data, what is twice the interquartile range?
How do you find the interquartile range?
We can find the interquartile range or IQR in four simple steps:
- Order the data from least to greatest
- Find the median
- Calculate the median of both the lower and upper half of the data
- The IQR is the difference between the upper and lower medians
Step 1: Order the data
In order to calculate the IQR, we need to begin by ordering the values of the data set from the least to the greatest. Likewise, in order to calculate the median, we need to arrange the numbers in ascending order (i.e. from the least to the greatest).
Let's sort an example data set with an odd number of values into ascending order.

}: 2, 2, 3, 3, 4, 5, 6, 9, 11")
Now, let's perform this task with another example data set that is comprised of an even number of values.

Rearrange into ascending order.
}: 1, 2, 2, 3, 4, 4, 7, 8, 9, 11")
Step 2: Calculate the median
Next, we need to calculate the median. The median is the "center" of the data. If the data set has an odd number of data points, then the mean is the centermost number. On the other hand, if the data set has an even number of values, then we will need to take the arithmetic average of the two centermost values. We will calculate this average by adding the two numbers together and then dividing that number by two.
First, we will find the median of a set with an odd number of values. Cross out values until you find the centermost point

The median of the odd valued data set is four.
Now, let's find the mean of the data set with an even number of values. Cross out values until you find the two centermost points and then calculate the average the two values.

Find the average of the two centermost values.


The median of the even valued set is four.
Step 3: Upper and lower medians
Once we have found the median of the entire set, we can find the medians of the upper and lower portions of the data. If the data set has an odd number of values, we will omit the median or centermost value of the set. Afterwards, we will find the individual medians for the upper and lower portions of the data.

Omit the centermost value.

Find the median of the lower portion.

Calculate the average of the two values.


The median of the lower portion is 
Find the median of the upper portion.

Calculate the average of the two values.


The median of the upper potion is 
If the data set has an even number of values, we will use the two values used to calculate the original median to divide the data set. These values are not omitted and become the largest value of the lower data set and the lowest values of the upper data set, respectively. Afterwards, we will calculate the medians of both the upper and lower portions.

Find the median of the lower portion.

The median of the lower portion is two.
Find the median of the upper portion.

The median of the upper portion is eight.
Step 4: Calculate the difference
Last, we need to calculate the difference of the upper and lower medians by subtracting the lower median from the upper median. This value equals the IQR.
Let's find the IQR of the odd data set.


Finally, we will find the IQR of the even data set.


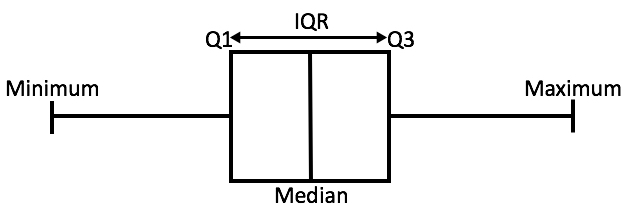
In order to better illustrate these values, their positions in a box plot have been labeled in the provided image.
Now that we have solved a few examples, let's use this knowledge to solve the given problem.
Solution:
First, we need to put the data in order from smallest to largest.

 = median of the overall data set
 = median of the lower half of the data
 = median of the upper half of the data

 is the overall median, leaving
  as the lower half of the data and
  as the upper half of the data.
The median of the lower half falls between two values.

The median of the upper half falls between two values.

The interquartile range is the difference between the third and first quartiles.

Multiply by  to find the answer:

How do you find the interquartile range?
We can find the interquartile range or IQR in four simple steps:
- Order the data from least to greatest
- Find the median
- Calculate the median of both the lower and upper half of the data
- The IQR is the difference between the upper and lower medians
Step 1: Order the data
In order to calculate the IQR, we need to begin by ordering the values of the data set from the least to the greatest. Likewise, in order to calculate the median, we need to arrange the numbers in ascending order (i.e. from the least to the greatest).
Let's sort an example data set with an odd number of values into ascending order.
Now, let's perform this task with another example data set that is comprised of an even number of values.
Rearrange into ascending order.
Step 2: Calculate the median
Next, we need to calculate the median. The median is the "center" of the data. If the data set has an odd number of data points, then the mean is the centermost number. On the other hand, if the data set has an even number of values, then we will need to take the arithmetic average of the two centermost values. We will calculate this average by adding the two numbers together and then dividing that number by two.
First, we will find the median of a set with an odd number of values. Cross out values until you find the centermost point
The median of the odd valued data set is four.
Now, let's find the mean of the data set with an even number of values. Cross out values until you find the two centermost points and then calculate the average the two values.
Find the average of the two centermost values.
The median of the even valued set is four.
Step 3: Upper and lower medians
Once we have found the median of the entire set, we can find the medians of the upper and lower portions of the data. If the data set has an odd number of values, we will omit the median or centermost value of the set. Afterwards, we will find the individual medians for the upper and lower portions of the data.
Omit the centermost value.
Find the median of the lower portion.
Calculate the average of the two values.
The median of the lower portion is
Find the median of the upper portion.
Calculate the average of the two values.
The median of the upper potion is
If the data set has an even number of values, we will use the two values used to calculate the original median to divide the data set. These values are not omitted and become the largest value of the lower data set and the lowest values of the upper data set, respectively. Afterwards, we will calculate the medians of both the upper and lower portions.
Find the median of the lower portion.
The median of the lower portion is two.
Find the median of the upper portion.
The median of the upper portion is eight.
Step 4: Calculate the difference
Last, we need to calculate the difference of the upper and lower medians by subtracting the lower median from the upper median. This value equals the IQR.
Let's find the IQR of the odd data set.
Finally, we will find the IQR of the even data set.
In order to better illustrate these values, their positions in a box plot have been labeled in the provided image.
Now that we have solved a few examples, let's use this knowledge to solve the given problem.
Solution:
First, we need to put the data in order from smallest to largest.
The median of the lower half falls between two values.
The median of the upper half falls between two values.
The interquartile range is the difference between the third and first quartiles.
Multiply by
Compare your answer with the correct one above
Give the interquartile range of a data set with the following characteristics.
Mean: 72.1
Median: 70
Standard deviation: 4.6
Give the interquartile range of a data set with the following characteristics.
Mean: 72.1
Median: 70
Standard deviation: 4.6
The interquartile range is the difference between the first and third quartiles. The two pieces of information needed to determine interquartile range, the first and third quartiles, are missing; therefore, it is impossible to answer the question without more information.
The interquartile range is the difference between the first and third quartiles. The two pieces of information needed to determine interquartile range, the first and third quartiles, are missing; therefore, it is impossible to answer the question without more information.
Compare your answer with the correct one above
Determine the interquartile range of the following numbers:
42, 51, 62, 47, 38, 50, 54, 43
Determine the interquartile range of the following numbers:
42, 51, 62, 47, 38, 50, 54, 43
How do you find the interquartile range?
We can find the interquartile range or IQR in four simple steps:
- Order the data from least to greatest
- Find the median
- Calculate the median of both the lower and upper half of the data
- The IQR is the difference between the upper and lower medians
Step 1: Order the data
In order to calculate the IQR, we need to begin by ordering the values of the data set from the least to the greatest. Likewise, in order to calculate the median, we need to arrange the numbers in ascending order (i.e. from the least to the greatest).
Let's sort an example data set with an odd number of values into ascending order.
Now, let's perform this task with another example data set that is comprised of an even number of values.
Rearrange into ascending order.
Step 2: Calculate the median
Next, we need to calculate the median. The median is the "center" of the data. If the data set has an odd number of data points, then the mean is the centermost number. On the other hand, if the data set has an even number of values, then we will need to take the arithmetic average of the two centermost values. We will calculate this average by adding the two numbers together and then dividing that number by two.
First, we will find the median of a set with an odd number of values. Cross out values until you find the centermost point
The median of the odd valued data set is four.
Now, let's find the mean of the data set with an even number of values. Cross out values until you find the two centermost points and then calculate the average the two values.
Find the average of the two centermost values.
The median of the even valued set is four.
Step 3: Upper and lower medians
Once we have found the median of the entire set, we can find the medians of the upper and lower portions of the data. If the data set has an odd number of values, we will omit the median or centermost value of the set. Afterwards, we will find the individual medians for the upper and lower portions of the data.
Omit the centermost value.
Find the median of the lower portion.
Calculate the average of the two values.
The median of the lower portion is
Find the median of the upper portion.
Calculate the average of the two values.
The median of the upper potion is
If the data set has an even number of values, we will use the two values used to calculate the original median to divide the data set. These values are not omitted and become the largest value of the lower data set and the lowest values of the upper data set, respectively. Afterwards, we will calculate the medians of both the upper and lower portions.
Find the median of the lower portion.
The median of the lower portion is two.
Find the median of the upper portion.
The median of the upper portion is eight.
Step 4: Calculate the difference
Last, we need to calculate the difference of the upper and lower medians by subtracting the lower median from the upper median. This value equals the IQR.
Let's find the IQR of the odd data set.
Finally, we will find the IQR of the even data set.
In order to better illustrate these values, their positions in a box plot have been labeled in the provided image.
Now that we have solved a few examples, let's use this knowledge to solve the given problem.
Solution:
First reorder the numbers in ascending order:
38, 42, 43, 47, 50, 51, 54, 62
Then divide the numbers into 2 groups, each containing an equal number of values:
(38, 42, 43, 47)(50, 51, 54, 62)
Q1 is the median of the group on the left, and Q3 is the median of the group on the right. Because there is an even number in each group, we'll need to find the average of the 2 middle numbers:


The interquartile range is the difference between Q3 and Q1:

How do you find the interquartile range?
We can find the interquartile range or IQR in four simple steps:
- Order the data from least to greatest
- Find the median
- Calculate the median of both the lower and upper half of the data
- The IQR is the difference between the upper and lower medians
Step 1: Order the data
In order to calculate the IQR, we need to begin by ordering the values of the data set from the least to the greatest. Likewise, in order to calculate the median, we need to arrange the numbers in ascending order (i.e. from the least to the greatest).
Let's sort an example data set with an odd number of values into ascending order.
Now, let's perform this task with another example data set that is comprised of an even number of values.
Rearrange into ascending order.
Step 2: Calculate the median
Next, we need to calculate the median. The median is the "center" of the data. If the data set has an odd number of data points, then the mean is the centermost number. On the other hand, if the data set has an even number of values, then we will need to take the arithmetic average of the two centermost values. We will calculate this average by adding the two numbers together and then dividing that number by two.
First, we will find the median of a set with an odd number of values. Cross out values until you find the centermost point
The median of the odd valued data set is four.
Now, let's find the mean of the data set with an even number of values. Cross out values until you find the two centermost points and then calculate the average the two values.
Find the average of the two centermost values.
The median of the even valued set is four.
Step 3: Upper and lower medians
Once we have found the median of the entire set, we can find the medians of the upper and lower portions of the data. If the data set has an odd number of values, we will omit the median or centermost value of the set. Afterwards, we will find the individual medians for the upper and lower portions of the data.
Omit the centermost value.
Find the median of the lower portion.
Calculate the average of the two values.
The median of the lower portion is
Find the median of the upper portion.
Calculate the average of the two values.
The median of the upper potion is
If the data set has an even number of values, we will use the two values used to calculate the original median to divide the data set. These values are not omitted and become the largest value of the lower data set and the lowest values of the upper data set, respectively. Afterwards, we will calculate the medians of both the upper and lower portions.
Find the median of the lower portion.
The median of the lower portion is two.
Find the median of the upper portion.
The median of the upper portion is eight.
Step 4: Calculate the difference
Last, we need to calculate the difference of the upper and lower medians by subtracting the lower median from the upper median. This value equals the IQR.
Let's find the IQR of the odd data set.
Finally, we will find the IQR of the even data set.
In order to better illustrate these values, their positions in a box plot have been labeled in the provided image.
Now that we have solved a few examples, let's use this knowledge to solve the given problem.
Solution:
First reorder the numbers in ascending order:
38, 42, 43, 47, 50, 51, 54, 62
Then divide the numbers into 2 groups, each containing an equal number of values:
(38, 42, 43, 47)(50, 51, 54, 62)
Q1 is the median of the group on the left, and Q3 is the median of the group on the right. Because there is an even number in each group, we'll need to find the average of the 2 middle numbers:
The interquartile range is the difference between Q3 and Q1:
Compare your answer with the correct one above
Identify the first and third quartiles for the following set of numbers.
{11, 14, 9, 2, 27, 26, 5, 8, 19, 10, 12, 6}
Identify the first and third quartiles for the following set of numbers.
{11, 14, 9, 2, 27, 26, 5, 8, 19, 10, 12, 6}
{11, 14, 9, 2, 27, 26, 5, 8, 19, 10, 12, 6}
First, arrange the values in numerical order.
{2, 5, 6, 8, 9, 10, 11, 12, 14, 19, 26, 27}
Quartiles are the values that divide a set into four equal parts. Since this set has twelve values, "cut" the data after the 3rd and 9th value to find the 1st and 3rd quartile, respectively.
{2, 5, 6,| 8, 9, 10, 11, 12, 14,| 19, 26, 27}
The quartile will be the average of the values on either side of the "cut."
First Quartile = (6+8)/2=7
Third Quartile = (14+19)/2=16.5
Compare your answer with the correct one above
Salespeople who land in the top quartile of average customer satisfaction ratings at the end of the year receive a bonus. Among the set of average ratings below, what is the cutoff for receiving the bonus?
{98, 55, 67, 88, 85, 91, 83, 65, 77, 83}
Salespeople who land in the top quartile of average customer satisfaction ratings at the end of the year receive a bonus. Among the set of average ratings below, what is the cutoff for receiving the bonus?
{98, 55, 67, 88, 85, 91, 83, 65, 77, 83}
{98, 55, 67, 88, 85, 91, 83, 65, 77, 83}
Rearrange the values in order.
{55, 65, 67, 77, 83, 83, 85, 88, 91, 98}
To get quartiles, "cut" the data into four.
{55, 65, 6**|7, 77, 83,|** 83, 85, 8**|**8, 91, 98}
As you can see, the third "cut" is right at 88. Which means 88 is the cutoff for the top quartile based on this set of data.
Compare your answer with the correct one above