Scatter Plots
Practice Questions
Algebra II › Scatter Plots
Which of the following represents a positive association in a scatterplot?
A scatterplot correlates adult males' height vs. shoe size. What does the point ")
This scatter plot represents data about snack quality (

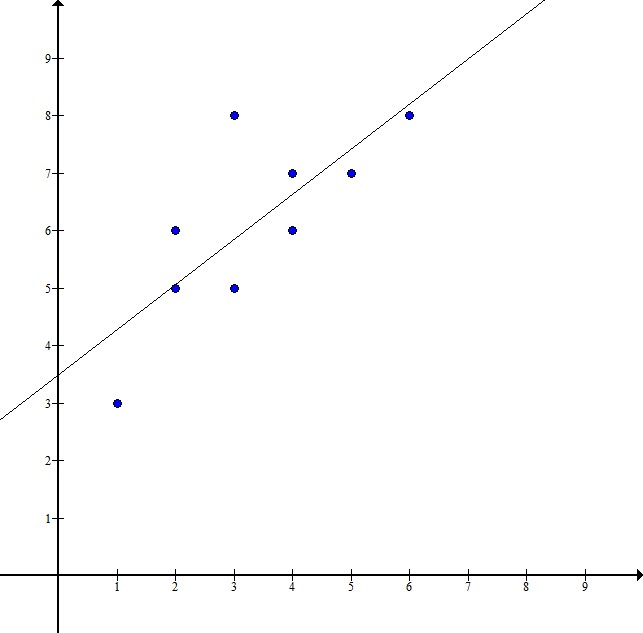
I. The price of a higher quality snack tends to be higher.
II. Points below the line represent snacks whose price is higher than their quality.
III. Points above the line represent snacks whose quality is higher than their price.
Which of the following would most likely represent an outlier on a scatterplot which relates height (in inches) to shoe size for men?
What would be the most accurate line of best fit for this scatter plot?
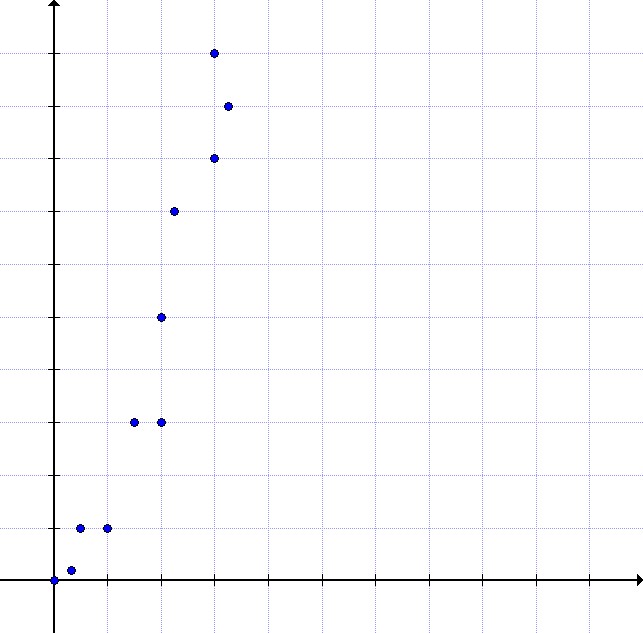
What type of correlation does this data have?