Histograms
Practice Questions
Algebra II › Histograms

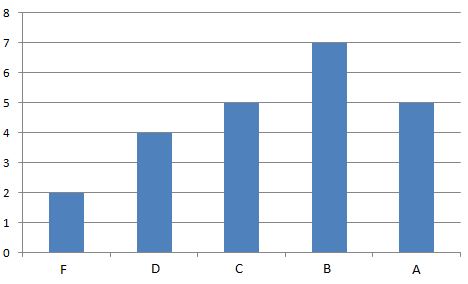
Refer to the above graph. Carla, a sixth grader at Polk, outscored 101 of the students who took the test. Which of these could her score have been?
Refer to the above bar graph.
How many students at Polk Middle School scored above 550 on the math portion of the SCAT?
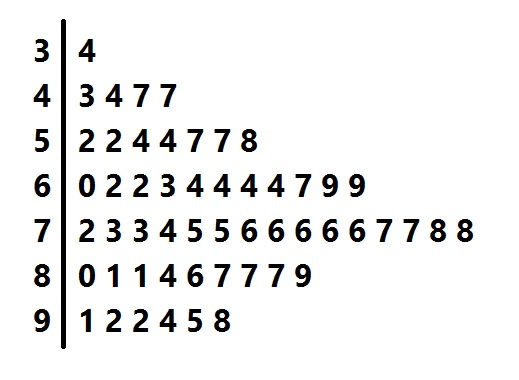
Above is a stem-and-leaf representation of the scores on a test administered to a group of students. What was the midrange of the scores?
The following histogram shows the highest level of education attained by the employees of a local store.
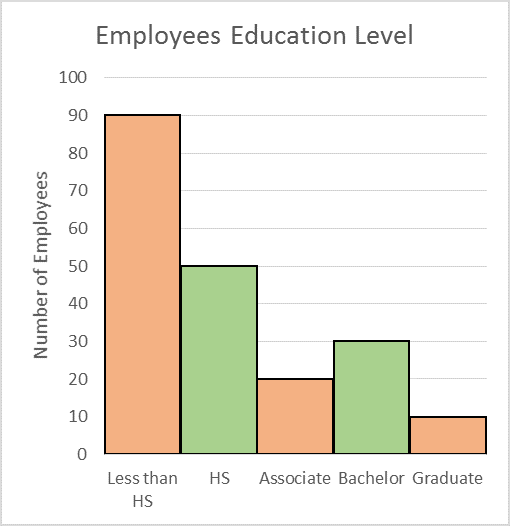
How many employees are working for the store?
The following histogram shows the highest level of education attained by the employees of a local store.
How many employees have at least an Associate degree?
This histogram shows the distribution of grades on Mr. Margarine's final. What percentage of the students got an A or B?