Representing Data
Practice Questions
Algebra II › Representing Data

Above is a stem-and-leaf representation of the scores on a test administered to a group of students. What was the mode of the scores?
Above is a stem-and-leaf representation of the scores on a test administered to a group of students. What was the mode of the scores?
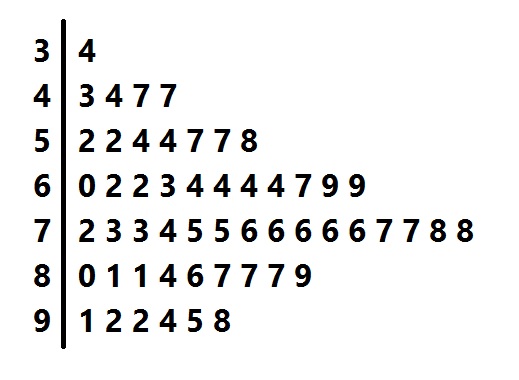
Above is a stem-and-leaf plot for the test scores administered to a group of students.
What was the median score?
Above is a stem-and-leaf plot for the test scores administered to a group of students.
What was the median score?
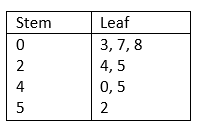
List the data values for the given Stem and Leaf plot.
List the data values for the given Stem and Leaf plot.

The box and whisker plot above can be used to find all of the following information about the data set that it describes except:
The box and whisker plot above can be used to find all of the following information about the data set that it describes except:
Create the Stem and Leaf plot for the given data values:
6, 8, 10, 23, 35, 43, 44, 45, 48
Create the Stem and Leaf plot for the given data values:
6, 8, 10, 23, 35, 43, 44, 45, 48