How to graph a function - Algebra 1
Card 0 of 3
Which equation best represents the following graph?
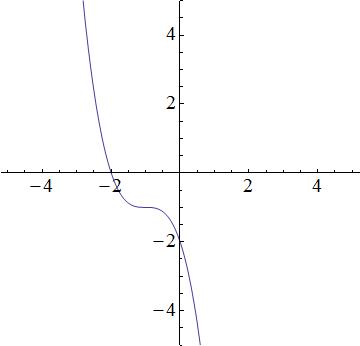
Which equation best represents the following graph?
We have the following answer choices.
=-(x + 1)^3 - 1")
=-(x + 1)^2 - 1")
=-x - 1")
=e^{2x-1}+\frac{1}{9}")
The first equation is a cubic function, which produces a function similar to the graph. The second equation is quadratic and thus, a parabola. The graph does not look like a prabola, so the 2nd equation will be incorrect. The third equation describes a line, but the graph is not linear; the third equation is incorrect. The fourth equation is incorrect because it is an exponential, and the graph is not an exponential. So that leaves the first equation as the best possible choice.
We have the following answer choices.
The first equation is a cubic function, which produces a function similar to the graph. The second equation is quadratic and thus, a parabola. The graph does not look like a prabola, so the 2nd equation will be incorrect. The third equation describes a line, but the graph is not linear; the third equation is incorrect. The fourth equation is incorrect because it is an exponential, and the graph is not an exponential. So that leaves the first equation as the best possible choice.
Compare your answer with the correct one above
Which graph depicts a function?
Which graph depicts a function?
A function may only have one y-value for each x-value.
The vertical line test can be used to identify the function. If at any point on the graph, a straight vertical line intersects the curve at more than one point, the curve is not a function.
A function may only have one y-value for each x-value.
The vertical line test can be used to identify the function. If at any point on the graph, a straight vertical line intersects the curve at more than one point, the curve is not a function.
Compare your answer with the correct one above
The graph below is the graph of a piece-wise function in some interval. Identify, in interval notation, the decreasing interval.
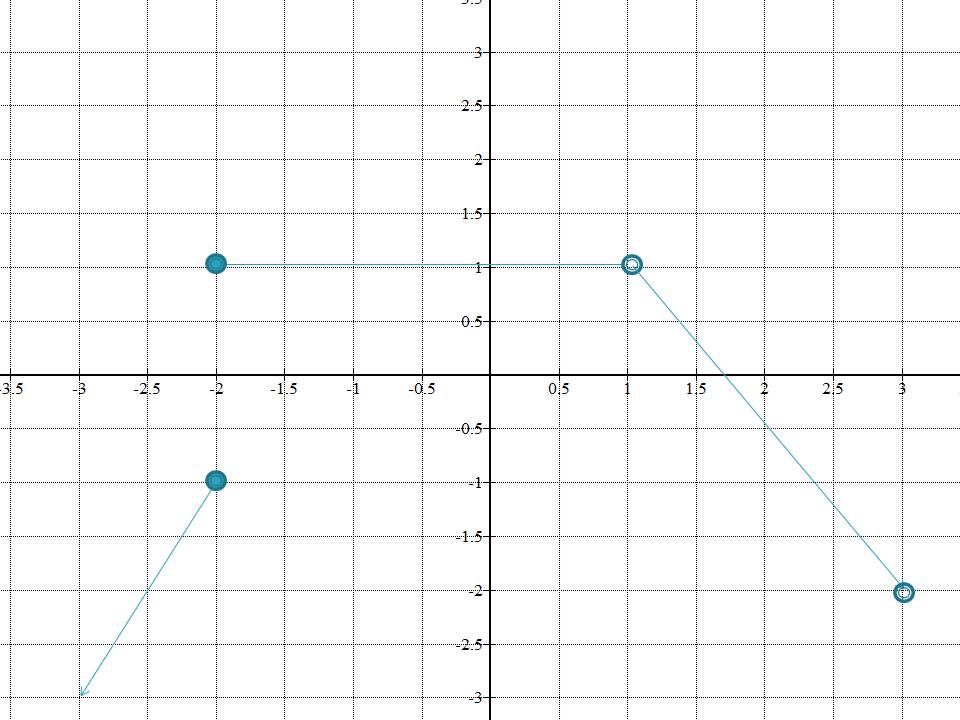
The graph below is the graph of a piece-wise function in some interval. Identify, in interval notation, the decreasing interval.
As is clear from the graph, in the interval between  (
( included) to
  , the
, the ") is constant at
is constant at  and then from
  (
( not included) to
  (
( not included), the
 ") is a decreasing function.
is a decreasing function.
As is clear from the graph, in the interval between
Compare your answer with the correct one above