Graphing - Algebra 1
Card 0 of 20
Which equation best represents the following graph?
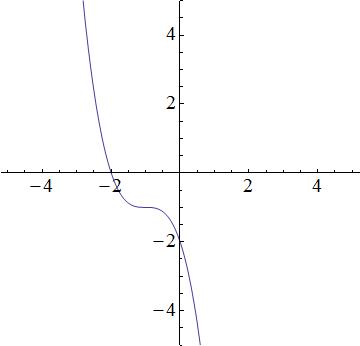
Which equation best represents the following graph?
We have the following answer choices.
=-(x + 1)^3 - 1")
=-(x + 1)^2 - 1")
=-x - 1")
=e^{2x-1}+\frac{1}{9}")
The first equation is a cubic function, which produces a function similar to the graph. The second equation is quadratic and thus, a parabola. The graph does not look like a prabola, so the 2nd equation will be incorrect. The third equation describes a line, but the graph is not linear; the third equation is incorrect. The fourth equation is incorrect because it is an exponential, and the graph is not an exponential. So that leaves the first equation as the best possible choice.
We have the following answer choices.
The first equation is a cubic function, which produces a function similar to the graph. The second equation is quadratic and thus, a parabola. The graph does not look like a prabola, so the 2nd equation will be incorrect. The third equation describes a line, but the graph is not linear; the third equation is incorrect. The fourth equation is incorrect because it is an exponential, and the graph is not an exponential. So that leaves the first equation as the best possible choice.
Compare your answer with the correct one above
Which graph depicts a function?
Which graph depicts a function?
A function may only have one y-value for each x-value.
The vertical line test can be used to identify the function. If at any point on the graph, a straight vertical line intersects the curve at more than one point, the curve is not a function.
A function may only have one y-value for each x-value.
The vertical line test can be used to identify the function. If at any point on the graph, a straight vertical line intersects the curve at more than one point, the curve is not a function.
Compare your answer with the correct one above
The graph below is the graph of a piece-wise function in some interval. Identify, in interval notation, the decreasing interval.
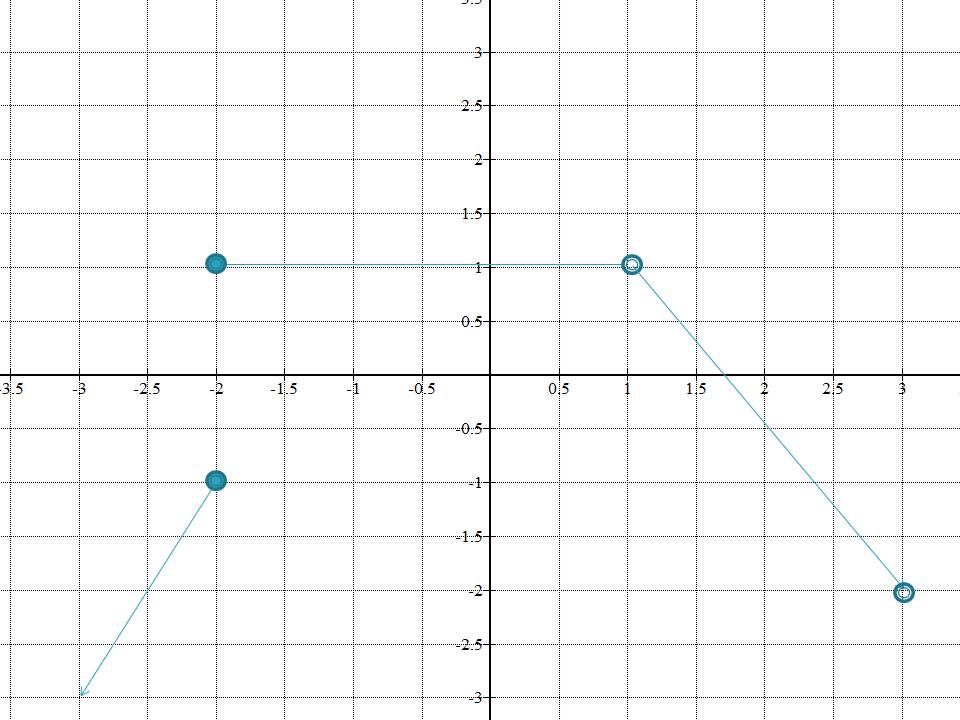
The graph below is the graph of a piece-wise function in some interval. Identify, in interval notation, the decreasing interval.
As is clear from the graph, in the interval between  (
( included) to
  , the
, the ") is constant at
is constant at  and then from
  (
( not included) to
  (
( not included), the
 ") is a decreasing function.
is a decreasing function.
As is clear from the graph, in the interval between
Compare your answer with the correct one above
Which of the following is the graph of the equation  ?
?
Which of the following is the graph of the equation
On the coordinate plane, the graph of an equation of the form  is a vertical line with its
  -intercept at
 ") . Therefore, the graph of
. Therefore, the graph of  is vertical with
  -intercept
 ") .
.
On the coordinate plane, the graph of an equation of the form
Compare your answer with the correct one above
Which of the following is the graph of the equation  ?
?
Which of the following is the graph of the equation
On the coordinate plane, the graph of an equation of the form  is a horizontal line with its
  -intercept at
 ") . Therefore, the graph of
. Therefore, the graph of  is horizontal with
  -intercept
 ") .
.
On the coordinate plane, the graph of an equation of the form
Compare your answer with the correct one above
Which of the following is the graph of the equation  ?
?
Which of the following is the graph of the equation
Since the intercepts are shown on each graph, we need to find the intercepts of  .
.
To find the  -intercept, set
  and solve for :


Therefore the  -intercept is
 ") .
.
To find the  -intercept, set
  and solve for :


Thus the  -intercept is
 ") .
.
The correct choice is the line that passes through these two points.
Since the intercepts are shown on each graph, we need to find the intercepts of
To find the
Therefore the
To find the
Thus the
The correct choice is the line that passes through these two points.
Compare your answer with the correct one above
Which of the following is the graph of the equation  ?
?
Which of the following is the graph of the equation
Since the intercepts are shown on each graph, we find the intercepts of  and compare them.
 -intercept:
Set 


The graph goes through ") . Since none of the graphs shown go through the origin, none of the graphs are correct.
. Since none of the graphs shown go through the origin, none of the graphs are correct.
Since the intercepts are shown on each graph, we find the intercepts of
Set
The graph goes through
Compare your answer with the correct one above
Which of the following graphs best represents the following function?
=2x-2")
Which of the following graphs best represents the following function?
=2x-2")
This equation describes a straight line with a slope of  and a y-intercept of
 ") . We know this by comparing the given equation to the formula for a line in slope-intercept form.
. We know this by comparing the given equation to the formula for a line in slope-intercept form.
=mx-b")
The graph below is the answer, as it depicts a straight line with a positive slope and a negative y-intercept.
This equation describes a straight line with a slope of
The graph below is the answer, as it depicts a straight line with a positive slope and a negative y-intercept.
Compare your answer with the correct one above
Which of the following choices is an accurate visual description of the graph of

Which of the following choices is an accurate visual description of the graph of
Though this is a question about a graph, we don't actually have to graph this equation to get a visual idea of its behavior. We just need to put it into slope-intercept form. First, we subtract  from both sides to get

Simplified, this equation becomes

Remember, this is in  form, where the slope is represented by
  . Therefore, the slope is negative. The y-intercept is represented by
  , which is
  in this case. So, the line has a negative slope and crosses the
  -axis at
 ") .
.
Though this is a question about a graph, we don't actually have to graph this equation to get a visual idea of its behavior. We just need to put it into slope-intercept form. First, we subtract
Simplified, this equation becomes
Remember, this is in
Compare your answer with the correct one above
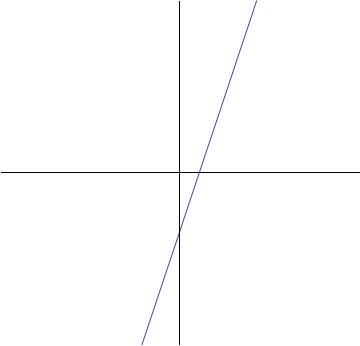
Which equation matches the graph of the line shown?

Which equation matches the graph of the line shown?
An equation of a line is made of two parts: a slope and a y-intercept.
The y-intercept is where the function crosses the y-axis which in this problem it is 0.
The slope is determined by the rise of the function over the run which is  , so the function is moving up one and over one.
Therefore your equation is:
 , which is simply
An equation of a line is made of two parts: a slope and a y-intercept.
The y-intercept is where the function crosses the y-axis which in this problem it is 0.
The slope is determined by the rise of the function over the run which is
Therefore your equation is:
Compare your answer with the correct one above
Which image depicts the point ") ?
?
Which image depicts the point
The first number,  indicates how far the point is positioned to the left or right of the origin. Because the number is negative, the point is three units to the LEFT of the origin. The second number indicates how far the point is postioned up or down from the origin. Because the number is positive, the point is located four units above the origin.
The first number,
Compare your answer with the correct one above
The length of line segment  is 12 units. If point A is located at
 ") , what is a possible location for point B?
, what is a possible location for point B?
The length of line segment
To answer this question, we will have to manipulate the distance formula:
^{2}+(y_{1}-y_{2})^{2}")
To get rid of the square root, we can square both sides:
^{2}}+(y_{1}-y_{2})^{2}}")
and plug in the information given in the question.
^{2}}+(5-y_{2})^{2}}")
^{2}}+(5-y_{2})^{2}}")
At this point we can simply plug in the possible values to determine which combination of coordinates will make the equation above true.
^{2}}+(5-(5+2{\sqrt{11}}))^{2}}")
^{2}+(2\sqrt{11})^{2}=100+44=144")
Thus the correct coordinate is,
") .
.
To answer this question, we will have to manipulate the distance formula:
To get rid of the square root, we can square both sides:
and plug in the information given in the question.
At this point we can simply plug in the possible values to determine which combination of coordinates will make the equation above true.
Thus the correct coordinate is,
Compare your answer with the correct one above
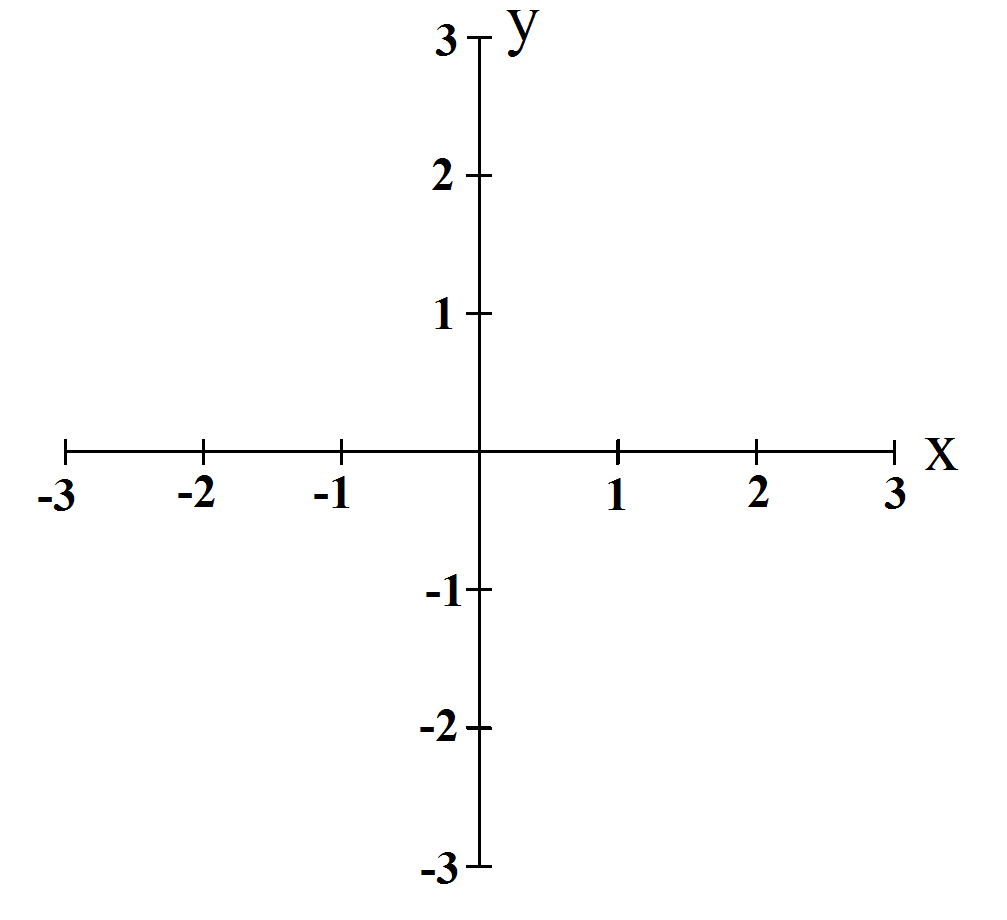
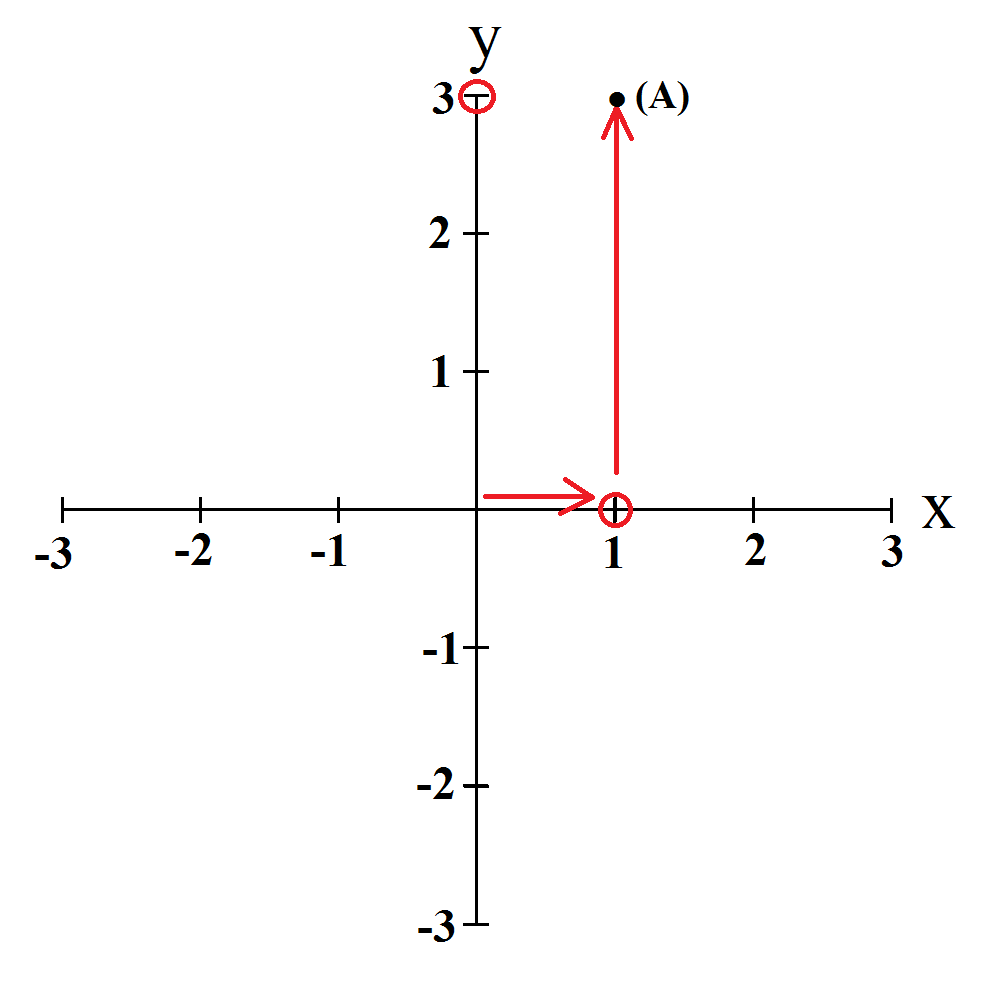
Graph the following 4 points. They will be displayed as (x,y) pairs.
(A) ")
(B) ")
(C) ")
(D) ")
Graph the following 4 points. They will be displayed as (x,y) pairs.
(A)
(B)
(C)
(D)
To graph these points we just need to remember that the first number is the x value and the second number is the y value. For (A) we have (1,3). So we move one tick over on the positive x-axis. Then from there we move up to the third tick on the y axis:
If the value is negative we must move in the other direction. So, for all 4 points,
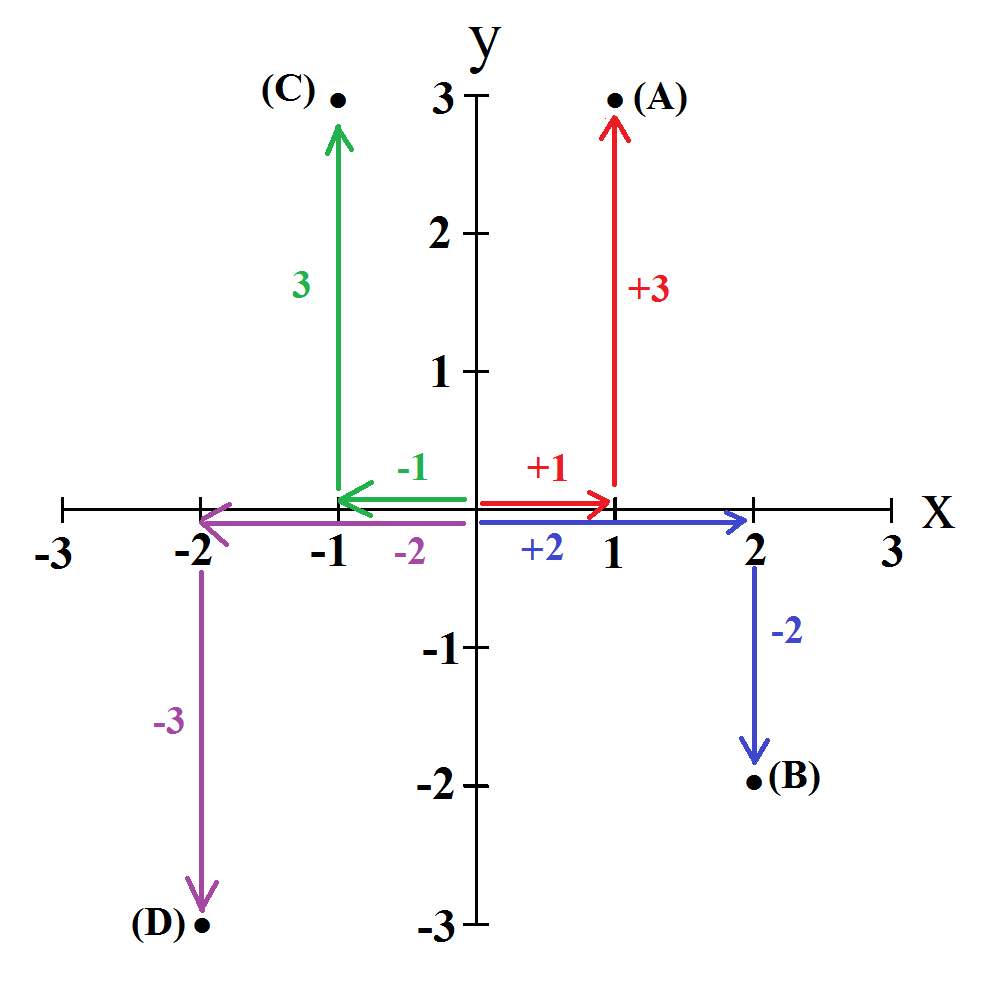
Compare your answer with the correct one above
What are the coordinates of the point on the given graph?
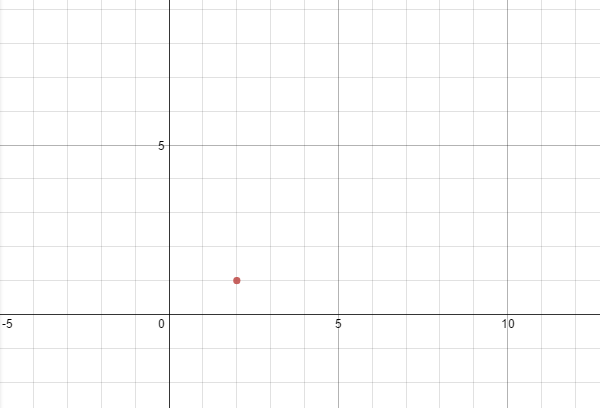
What are the coordinates of the point on the given graph?
When trying to determine coordinates of a point you need to look at the value of x first (how many units left or right the point is, then the y-value (how many up or down it is).
When you look at this point you see that it is moved right 2 units and up 1.
So your coordinates are:
")
When trying to determine coordinates of a point you need to look at the value of x first (how many units left or right the point is, then the y-value (how many up or down it is).
When you look at this point you see that it is moved right 2 units and up 1.
So your coordinates are:
Compare your answer with the correct one above
Which of the following graphs matches the function ^2-2") ?
?
Which of the following graphs matches the function
Start by visualizing the graph associated with the function  :
:
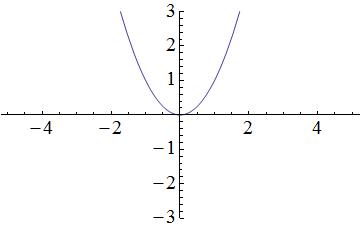
Terms within the parentheses associated with the squared x-variable will shift the parabola horizontally, while terms outside of the parentheses will shift the parabola vertically. In the provided equation, 2 is located outside of the parentheses and is subtracted from the terms located within the parentheses; therefore, the parabola in the graph will shift down by 2 units. A simplified graph of  looks like this:
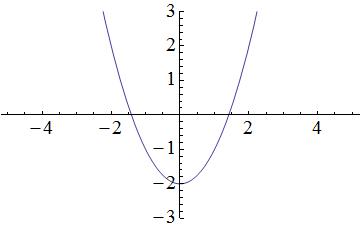
Remember that there is also a term within the parentheses. Within the parentheses, 1 is subtracted from the x-variable; thus, the parabola in the graph will shift to the right by 1 unit. As a result, the following graph matches the given function ^2-2") :
:
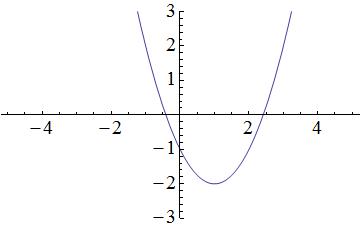
Start by visualizing the graph associated with the function
Terms within the parentheses associated with the squared x-variable will shift the parabola horizontally, while terms outside of the parentheses will shift the parabola vertically. In the provided equation, 2 is located outside of the parentheses and is subtracted from the terms located within the parentheses; therefore, the parabola in the graph will shift down by 2 units. A simplified graph of
Remember that there is also a term within the parentheses. Within the parentheses, 1 is subtracted from the x-variable; thus, the parabola in the graph will shift to the right by 1 unit. As a result, the following graph matches the given function
Compare your answer with the correct one above
For the graph below, match the graph b with one of the following equations:
")

")
^{2}")
")
^{2}")
")
^{2} -2")
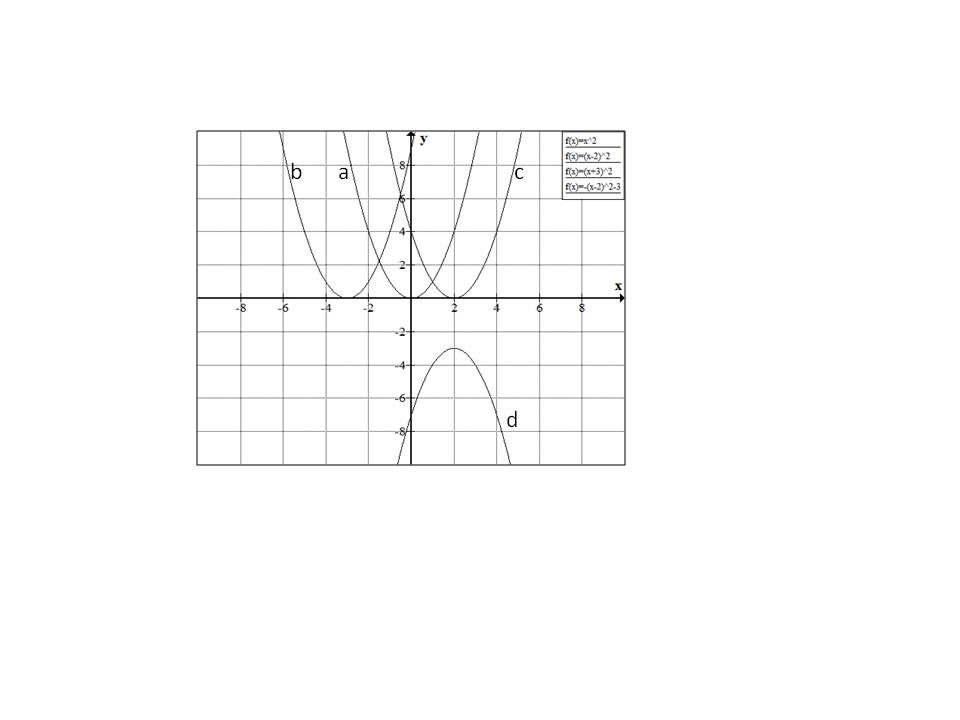
For the graph below, match the graph b with one of the following equations:
Starting with 
^{2}") moves the parabola
moves the parabola  by
by  units to the right.
Similarly ^{2}") moves the parabola by
moves the parabola by  units to the left.
Hence the correct answer is option  .
.
Starting with
Similarly
Hence the correct answer is option
Compare your answer with the correct one above
What is the minimum possible value of the expression below?

What is the minimum possible value of the expression below?
We can determine the lowest possible value of the expression by finding the  -coordinate of the vertex of the parabola graphed from the equation
  . This is done by rewriting the equation in vertex form.

-10")
-3* 1-10")
^{2}-13")
The vertex of the parabola ^{2}-13") is the point
is the point ") .
.
The parabola is concave upward (its quadratic coefficient is positive), so  represents the minimum value of
  . This is our answer.
We can determine the lowest possible value of the expression by finding the
The vertex of the parabola
The parabola is concave upward (its quadratic coefficient is positive), so
Compare your answer with the correct one above
What is the vertex of the function =2(x-4)^2+7") ? Is it a maximum or minimum?
? Is it a maximum or minimum?
What is the vertex of the function
The equation of a parabola can be written in vertex form: =a(x-h)^2+k") .
.
The point ") in this format is the vertex. If
in this format is the vertex. If  is a postive number the vertex is a minimum, and if
  is a negative number the vertex is a maximum.
=2(x-4)^2+7")
In this example,  . The positive value means the vertex is a minimum.

=(4,7)")
The equation of a parabola can be written in vertex form:
The point
In this example,
Compare your answer with the correct one above
Which of the graphs best represents the following function?
=\frac{9}{10}x^2-7x+2")
Which of the graphs best represents the following function?
=\frac{9}{10}x^2-7x+2")
The highest exponent of the variable term is two ( ). This tells that this function is quadratic, meaning that it is a parabola.
The graph below will be the answer, as it shows a parabolic curve.
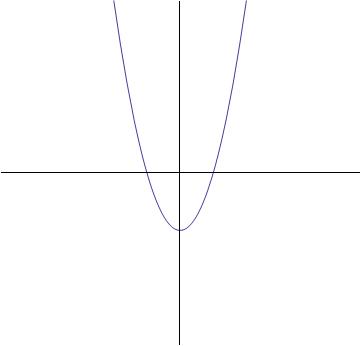
The highest exponent of the variable term is two (
The graph below will be the answer, as it shows a parabolic curve.
Compare your answer with the correct one above
What is the equation of a parabola with vertex ") and
and  -intercept
 ") ?
?
What is the equation of a parabola with vertex
From the vertex, we know that the equation of the parabola will take the form  ^{2}+ 1") for some
for some  .
.
To calculate that  , we plug in the values from the other point we are given,
  , and solve for :
^{2} + 1")
^{2} + 1")
^{2} + 1")


Now the equation is ^{2} + 1") . This is not an answer choice, so we need to rewrite it in some way.
. This is not an answer choice, so we need to rewrite it in some way.
Expand the squared term:
 + 1")
Distribute the fraction through the parentheses:

Combine like terms:

From the vertex, we know that the equation of the parabola will take the form
To calculate that
Now the equation is
Expand the squared term:
Distribute the fraction through the parentheses:
Combine like terms:
Compare your answer with the correct one above