How to graph a function - Advanced Geometry
Card 0 of 20
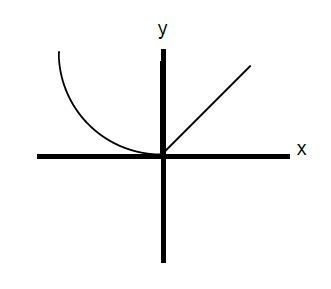
Which of the following graphs does NOT represent a function?
Which of the following graphs does NOT represent a function?
This question relies on both the vertical-line test and the definition of a function. We need to use the vertical-line test to determine which of the graphs is not a function (i.e. the graph that has more than one output for a given input). The vertical-line test states that a graph represents a function when a vertical line can be drawn at every point in the graph and only intersect it at one point; thus, if a vertical line is drawn in a graph and it intersects that graph at more than one point, then the graph is not a function. The circle is the only answer choice that fails the vertical-line test, and so it is not a function.
This question relies on both the vertical-line test and the definition of a function. We need to use the vertical-line test to determine which of the graphs is not a function (i.e. the graph that has more than one output for a given input). The vertical-line test states that a graph represents a function when a vertical line can be drawn at every point in the graph and only intersect it at one point; thus, if a vertical line is drawn in a graph and it intersects that graph at more than one point, then the graph is not a function. The circle is the only answer choice that fails the vertical-line test, and so it is not a function.
Compare your answer with the correct one above
Suppose  .
.
To obtain the graph of  + c") , shift the graph
, shift the graph ") a distance of
a distance of  units .
Suppose
To obtain the graph of
There are four shifts of the graph y = f(x):
y = f(x) + c shifts the graph c units upwards.
y = f(x) – c shifts the graph c units downwards.
y = f(x + c) shifts the graph c units to the left.
y = f(x – c) shifts the graph c units to the right.
There are four shifts of the graph y = f(x):
y = f(x) + c shifts the graph c units upwards.
y = f(x) – c shifts the graph c units downwards.
y = f(x + c) shifts the graph c units to the left.
y = f(x – c) shifts the graph c units to the right.
Compare your answer with the correct one above
The figure above shows the graph of y = f(x). Which of the following is the graph of y = |f(x)|?
The figure above shows the graph of y = f(x). Which of the following is the graph of y = |f(x)|?
One of the properties of taking an absolute value of a function is that the values are all made positive. The values themselves do not change; only their signs do. In this graph, none of the y-values are negative, so none of them would change. Thus the two graphs should be identical.
One of the properties of taking an absolute value of a function is that the values are all made positive. The values themselves do not change; only their signs do. In this graph, none of the y-values are negative, so none of them would change. Thus the two graphs should be identical.
Compare your answer with the correct one above
Below is the graph of the function ") :
:
Which of the following could be the equation for ") ?
?
Below is the graph of the function
Which of the following could be the equation for
First, because the graph consists of pieces that are straight lines, the function must include an absolute value, whose functions usually have a distinctive "V" shape. Thus, we can eliminate f(x) = x2 – 4x + 3 from our choices. Furthermore, functions with x2 terms are curved parabolas, and do not have straight line segments. This means that f(x) = |x2 – 4x| – 3 is not the correct choice.
Next, let's examine f(x) = |2x – 6|. Because this function consists of an abolute value by itself, its graph will not have any negative values. An absolute value by itself will only yield non-negative numbers. Therefore, because the graph dips below the x-axis (which means f(x) has negative values), f(x) = |2x – 6| cannot be the correct answer.
Next, we can analyze f(x) = |x – 1| – 2. Let's allow x to equal 1 and see what value we would obtain from f(1).
f(1) = | 1 – 1 | – 2 = 0 – 2 = –2
However, the graph above shows that f(1) = –4. As a result, f(x) = |x – 1| – 2 cannot be the correct equation for the function.
By process of elimination, the answer must be f(x) = |2x – 2| – 4. We can verify this by plugging in several values of x into this equation. For example f(1) = |2 – 2| – 4 = –4, which corresponds to the point (1, –4) on the graph above. Likewise, if we plug 3 or –1 into the equation f(x) = |2x – 2| – 4, we obtain zero, meaning that the graph should cross the x-axis at 3 and –1. According to the graph above, this is exactly what happens.
The answer is f(x) = |2x – 2| – 4.
Compare your answer with the correct one above
Which of the following could be a value of  for
for  ?
?
Which of the following could be a value of
The graph is a down-opening parabola with a maximum of  . Therefore, there are no y values greater than this for this function.
The graph is a down-opening parabola with a maximum of
Compare your answer with the correct one above
What is the domain of  ?
?
What is the domain of
The domain of the function specifies the values that  can take. Here,
  is defined for every value of
  , so the domain is all real numbers.
The domain of the function specifies the values that
Compare your answer with the correct one above
What is the domain of  ?
?
What is the domain of
To find the domain, we need to decide which values  can take. The
  is under a square root sign, so
  cannot be negative.
  can, however, be 0, because we can take the square root of zero. Therefore the domain is
  .
.
To find the domain, we need to decide which values
Compare your answer with the correct one above
What is the domain of the function  ?
?
What is the domain of the function
To find the domain, we must find the interval on which  is defined. We know that the expression under the radical must be positive or 0, so
  is defined when
  . This occurs when
  and
and  . In interval notation, the domain is
  .
.
To find the domain, we must find the interval on which
Compare your answer with the correct one above
Define the functions  and
and  as follows:
 = 2x + \sqrt{x - 1}")
 = 6x - \sqrt{x-1}")
What is the domain of the function (x)") ?
?
Define the functions
What is the domain of the function
The domain of ") is the intersection of the domains of
is the intersection of the domains of  and
and  .
.  and
and  are each restricted to all values of
  that allow the radicand
  to be nonnegative - that is,
 , or
, or

Since the domains of  and
and  are the same, the domain of
 ") is also the same. In interval form the domain of
is also the same. In interval form the domain of ") is
is ")
The domain of
Since the domains of
Compare your answer with the correct one above
Define  = \frac{1}{x ^{2}- 25 }") .
.
What is the natural domain of  ?
?
Define
What is the natural domain of
The only restriction on the domain of  is that the denominator cannot be 0. We set the denominator to 0 and solve for
  to find the excluded values:


The domain is the set of all real numbers except those two - that is,
 \cup \left ( -5,5\right ) \cup (5, \infty)") .
.
The only restriction on the domain of
The domain is the set of all real numbers except those two - that is,
Compare your answer with the correct one above
Define  = \frac{1}{\sqrt[3]{x -27}}")
What is the natural domain of  ?
?
Define
What is the natural domain of
The radical in and of itself does not restrict the domain, since every real number has a real cube root. However, since the expression  is in a denominator, it cannot be equal to zero, so the domain excludes the value(s) for which

^{3}= 0^{3}")


27 is the only number excluded from the domain.
The radical in and of itself does not restrict the domain, since every real number has a real cube root. However, since the expression
27 is the only number excluded from the domain.
Compare your answer with the correct one above
Define  = \frac{x}{x^{2}+3x-4 }")
What is the natural domain of  ?
?
Define
What is the natural domain of
Since the expression  is in a denominator, it cannot be equal to zero, so the domain excludes the value(s) for which
  . We solve for
  by factoring the polynomial, which we can do as follows:

(x+?)=0")
Replacing the question marks with integers whose product is  and whose sum is 3:
(x-1)=0")


Therefore, the domain excludes these two values of  .
.
Since the expression
Replacing the question marks with integers whose product is
Therefore, the domain excludes these two values of
Compare your answer with the correct one above
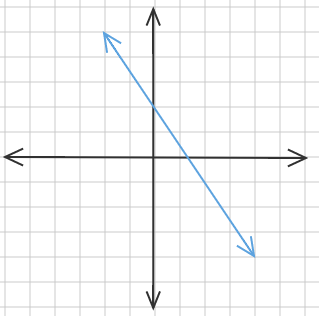
What is the equation for the line pictured above?
What is the equation for the line pictured above?
A line has the equation
 where
where  is the
  intercept and
  is the slope.
The  intercept can be found by noting the point where the line and the y-axis cross, in this case, at
 ") so
so  .
.
The slope can be found by selecting two points, for example, the y-intercept and the next point over that crosses an even point, for example, ") .
.
Now applying the slope formula,

which yields  .
.
Therefore the equation of the line becomes:

A line has the equation
The
The slope can be found by selecting two points, for example, the y-intercept and the next point over that crosses an even point, for example,
Now applying the slope formula,
which yields
Therefore the equation of the line becomes:
Compare your answer with the correct one above
The chord of a  central angle of a circle with circumference
  has what length?
The chord of a
A circle with circumference  has as its radius
 .
.
The circle, the central angle, and the chord are shown below:

By way of the Isosceles Triangle Theorem,  can be proved equilateral, so
  , the correct response.
A circle with circumference
The circle, the central angle, and the chord are shown below:
By way of the Isosceles Triangle Theorem,
Compare your answer with the correct one above
The chord of a  central angle of a circle with area
  has what length?
The chord of a
The radius  of a circle with area
  can be found as follows:


The circle, the central angle, and the chord are shown below:

By way of the Isosceles Triangle Theorem, can be proved equilateral, so  , the correct response.
The radius
The circle, the central angle, and the chord are shown below:
By way of the Isosceles Triangle Theorem,
Compare your answer with the correct one above
The chord of a  central angle of a circle with area
  has what length?
The chord of a
The radius  of a circle with area
  can be found as follows:


The circle, the central angle, and the chord are shown below, along with  , which bisects isosceles

We concentrate on  , a 30-60-90 triangle. By the 30-60-90 Theorem,

and

The chord  has length twice this, or

The radius
The circle, the central angle, and the chord are shown below, along with
We concentrate on
and
The chord
Compare your answer with the correct one above
=2x+4")
Which of the following graphs represents the y-intercept of this function?
Which of the following graphs represents the y-intercept of this function?
Graphically, the y-intercept is the point at which the graph touches the y-axis. Algebraically, it is the value of  when
when  .
.
Here, we are given the function =2x+4") . In order to calculate the y-intercept, set
. In order to calculate the y-intercept, set  equal to zero and solve for
  .
.
+4")

So the y-intercept is at ") .
.
Graphically, the y-intercept is the point at which the graph touches the y-axis. Algebraically, it is the value of
Here, we are given the function
So the y-intercept is at
Compare your answer with the correct one above
=2x+4")
Which of the following graphs represents the x-intercept of this function?
Which of the following graphs represents the x-intercept of this function?
Graphically, the x-intercept is the point at which the graph touches the x-axis. Algebraically, it is the value of  for which
  .
.
Here, we are given the function =2x+4") . In order to calculate the x-intercept, set
. In order to calculate the x-intercept, set  equal to zero and solve for
  .
.


So the x-intercept is at ") .
.
Graphically, the x-intercept is the point at which the graph touches the x-axis. Algebraically, it is the value of
Here, we are given the function
So the x-intercept is at
Compare your answer with the correct one above
Which of the following represents =\frac{1}{2}x-2") ?
?
Which of the following represents
A line is defined by any two points on the line. It is frequently simplest to calculate two points by substituting zero for x and solving for y, and by substituting zero for y and solving for x.
=\frac{1}{2}x-2")
Let  . Then
-2")

So our first set of points (which is also the y-intercept) is ")
Let  . Then


So our second set of points (which is also the x-intercept) is )") .
.
A line is defined by any two points on the line. It is frequently simplest to calculate two points by substituting zero for x and solving for y, and by substituting zero for y and solving for x.
Let
So our first set of points (which is also the y-intercept) is
Let
So our second set of points (which is also the x-intercept) is
Compare your answer with the correct one above
Which graph accurately represents the following function:

Which graph accurately represents the following function:
The first step in determining which graph is correct is finding the origin of the function. If both x and y are equal to 0, the coordinates of the origin would be ") . The second step is to determine whether the graph opens up or down. The x and y are both positive, so the parabola will open upwards. The correct graph will look like
. The second step is to determine whether the graph opens up or down. The x and y are both positive, so the parabola will open upwards. The correct graph will look like

The first step in determining which graph is correct is finding the origin of the function. If both x and y are equal to 0, the coordinates of the origin would be
Compare your answer with the correct one above