How to find synthesis of data in chemistry - ACT Science
Card 0 of 20
The Ideal Gas Law is as follows:

 is pressure as measured in Pascals,
  is volume as measured in cubic meters,
  is the number of moles of the gas,
  is the gas constant known as 8.314 Joules per mole times Kelvin, and
  is the temperature measured in Kelvin.
A class of students began studying the Ideal Gas Law and how the Pressure and the Volume relate to one another. They took 20 moles of a sample gas and kept the room at a temperature of 300 Kelvin. They then used different sized containers of the gas to limit and expand the volume. At each different volume, they measure the pressure of the gas on its container. The table they made from their results is seen in table 1.
Volume of the container Pressure Measured in Pascals 1 cubic meter 49,884 Pascals 2 cubic meters 24,942 Pascals 3 cubic meters 16,628 Pascals 4 cubic meters 12,471 Pascals 5 cubic meters 9,976.8 Pascals 6 cubic meters 8,314 Pascals 7 cubic meters 7,126.2 Pascals
TABLE 1
And they graph their findings in Figure 1.
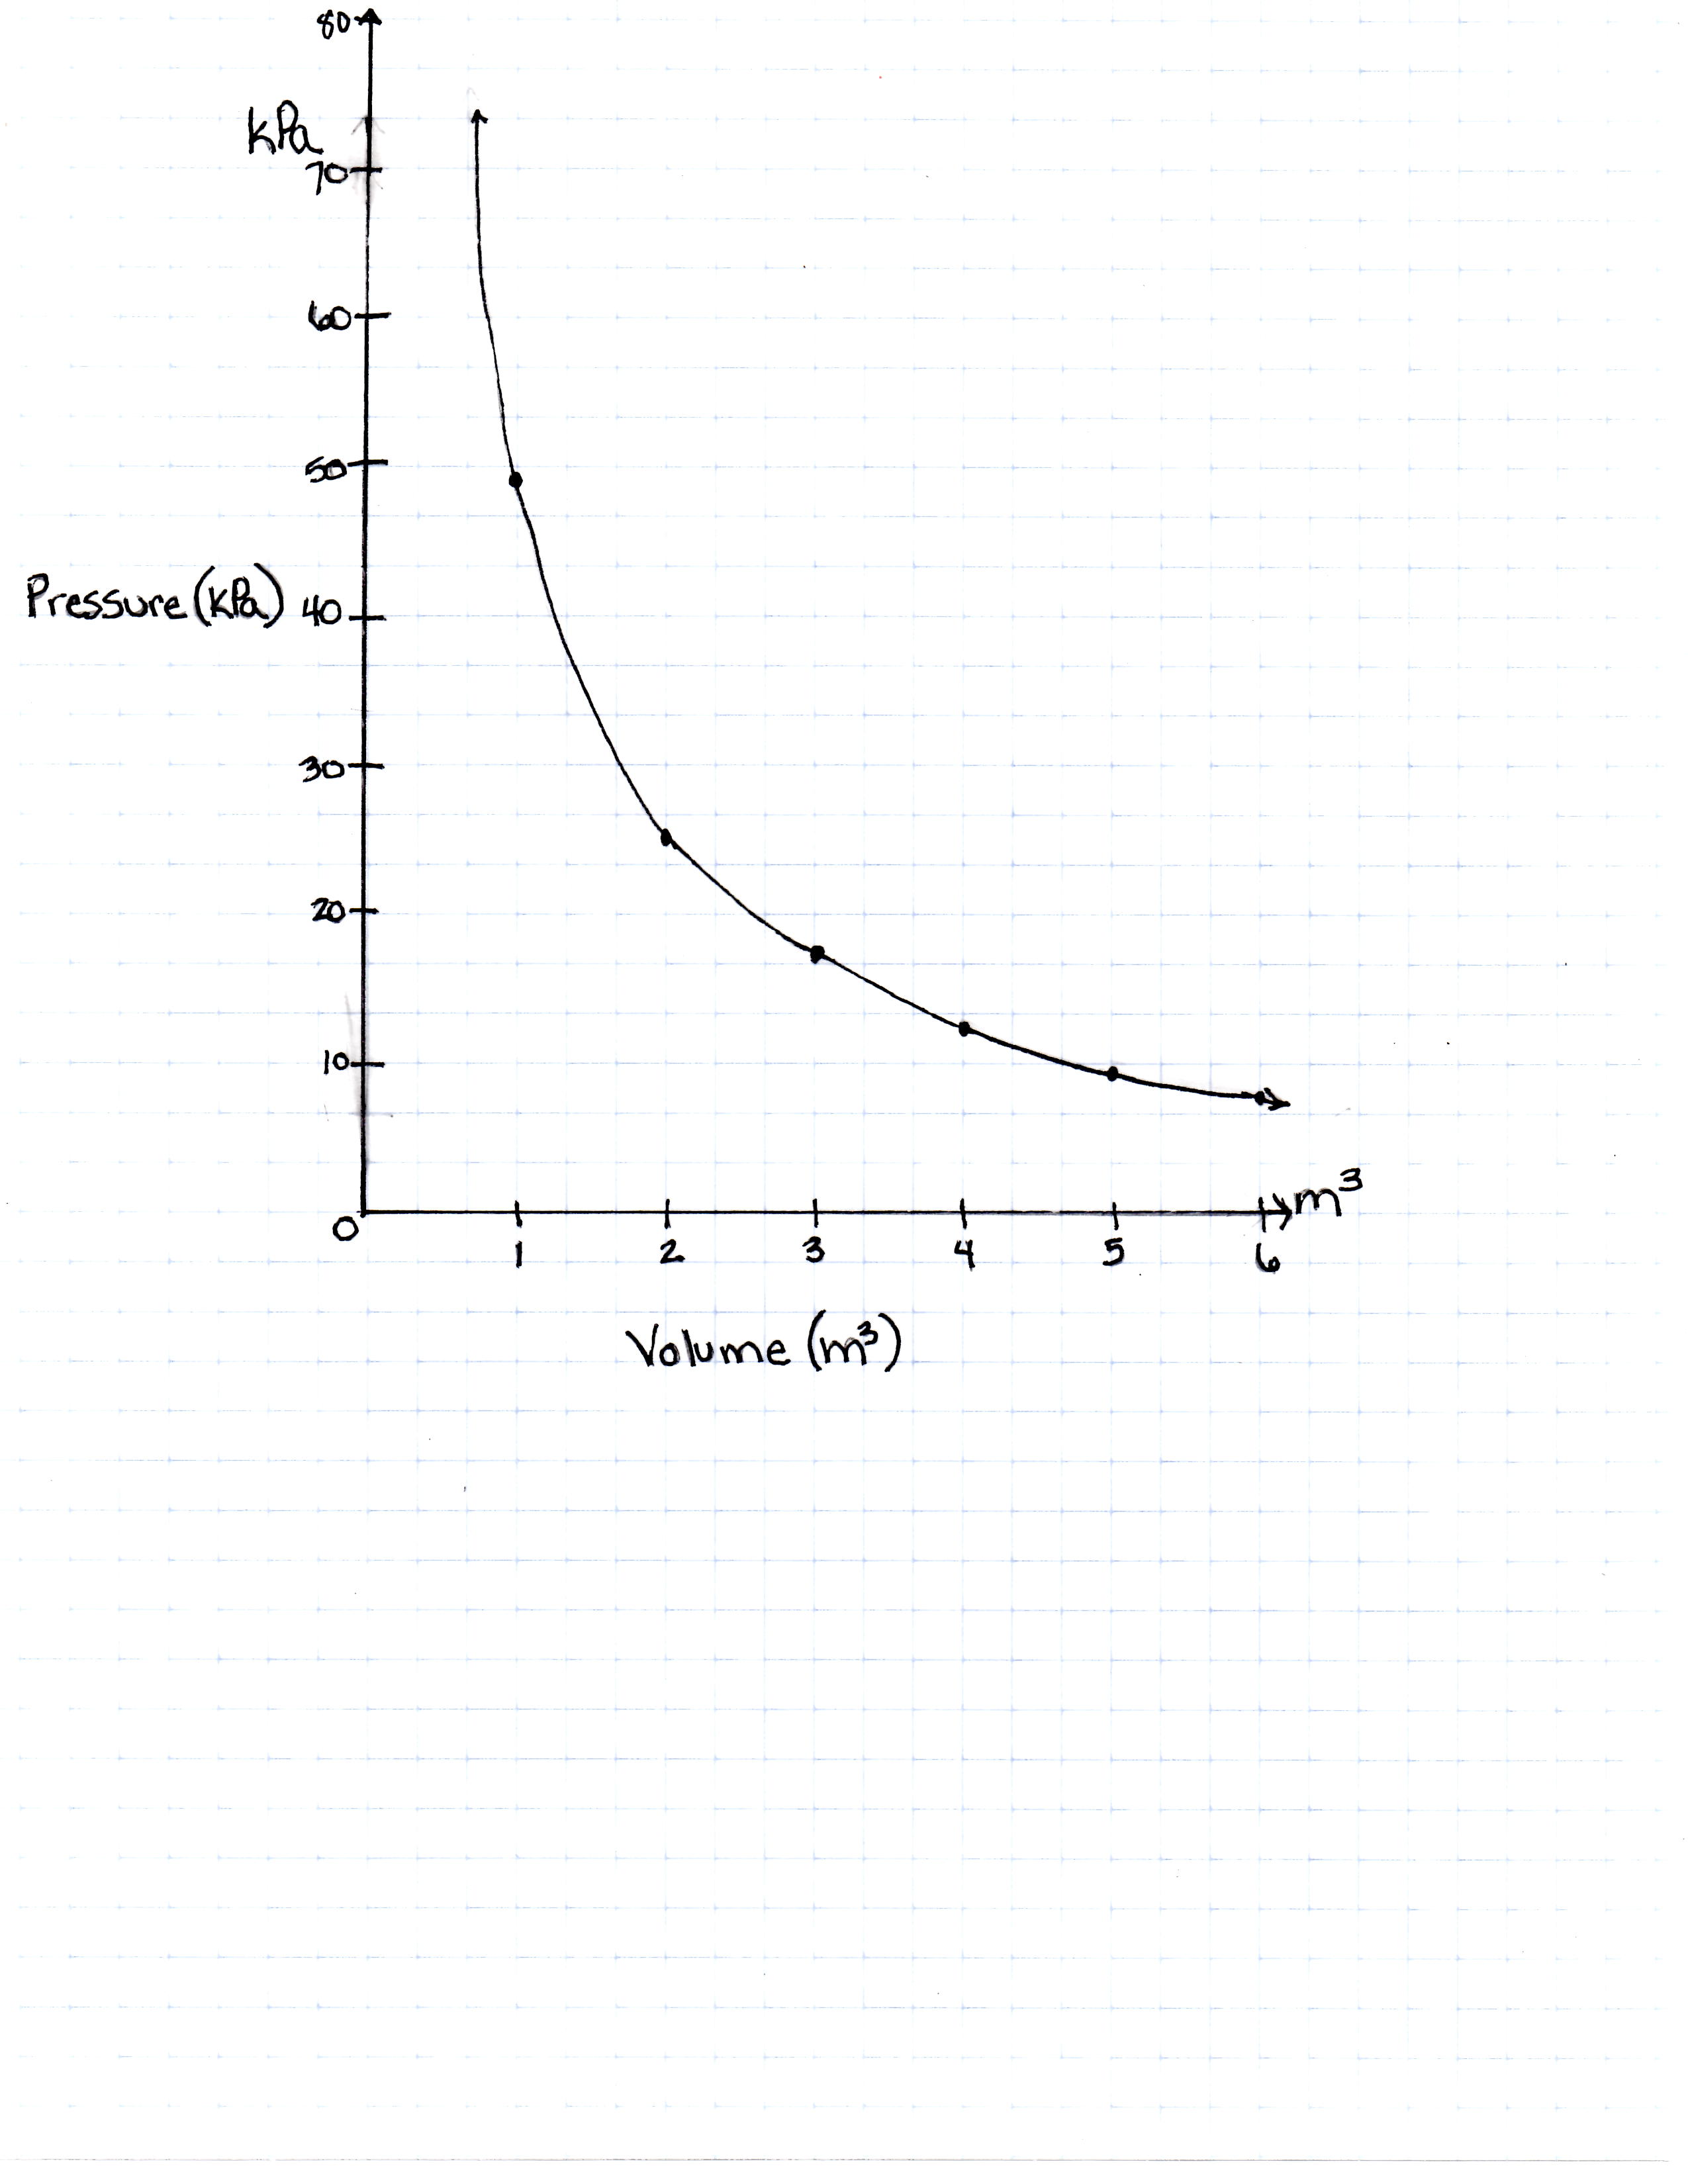
FIGURE 1
Would Figure 1 be the same for 1 mole of hydrogen gas as it would be for 1 mole of oxygen gas?
The Ideal Gas Law is as follows:
A class of students began studying the Ideal Gas Law and how the Pressure and the Volume relate to one another. They took 20 moles of a sample gas and kept the room at a temperature of 300 Kelvin. They then used different sized containers of the gas to limit and expand the volume. At each different volume, they measure the pressure of the gas on its container. The table they made from their results is seen in table 1.
| Volume of the container | Pressure Measured in Pascals |
|---|---|
| 1 cubic meter | 49,884 Pascals |
| 2 cubic meters | 24,942 Pascals |
| 3 cubic meters | 16,628 Pascals |
| 4 cubic meters | 12,471 Pascals |
| 5 cubic meters | 9,976.8 Pascals |
| 6 cubic meters | 8,314 Pascals |
| 7 cubic meters | 7,126.2 Pascals |
TABLE 1
And they graph their findings in Figure 1.
FIGURE 1
Would Figure 1 be the same for 1 mole of hydrogen gas as it would be for 1 mole of oxygen gas?
Moles is a measure of the amount of any type of gas; the Ideal Gas Law does not need or have a place for a variable type of gas. The number of moles of any type of gas fits into the equation.
Moles is a measure of the amount of any type of gas; the Ideal Gas Law does not need or have a place for a variable type of gas. The number of moles of any type of gas fits into the equation.
Compare your answer with the correct one above
The Ideal Gas Law is as follows:

 is pressure as measured in Pascals,
  is volume as measured in cubic meters,
  is the number of moles of the gas,
  is the gas constant known as 8.314 Joules per mole times Kelvin, and
  is the temperature measured in Kelvin.
A class of students began studying the Ideal Gas Law and how the Pressure and the Volume relate to one another. They took 20 moles of a sample gas and kept the room at a temperature of 300 Kelvin. They then used different sized containers of the gas to limit and expand the volume. At each different volume, they measure the pressure of the gas on its container. The table they made from their results is seen in table 1.
Volume of the container Pressure Measured in Pascals 1 cubic meter 49,884 Pascals 2 cubic meters 24,942 Pascals 3 cubic meters 16,628 Pascals 4 cubic meters 12,471 Pascals 5 cubic meters 9,976.8 Pascals 6 cubic meters 8,314 Pascals 7 cubic meters 7,126.2 Pascals
TABLE 1
And they graph their findings in Figure 1.
FIGURE 1
What would the pressure be if the volume was 100 cubic meters?
The Ideal Gas Law is as follows:
A class of students began studying the Ideal Gas Law and how the Pressure and the Volume relate to one another. They took 20 moles of a sample gas and kept the room at a temperature of 300 Kelvin. They then used different sized containers of the gas to limit and expand the volume. At each different volume, they measure the pressure of the gas on its container. The table they made from their results is seen in table 1.
| Volume of the container | Pressure Measured in Pascals |
|---|---|
| 1 cubic meter | 49,884 Pascals |
| 2 cubic meters | 24,942 Pascals |
| 3 cubic meters | 16,628 Pascals |
| 4 cubic meters | 12,471 Pascals |
| 5 cubic meters | 9,976.8 Pascals |
| 6 cubic meters | 8,314 Pascals |
| 7 cubic meters | 7,126.2 Pascals |
TABLE 1
And they graph their findings in Figure 1.
FIGURE 1
What would the pressure be if the volume was 100 cubic meters?
One can plug 100 cubic meters into the equation, but the equation is measured in pascals. To find it in the SI unit kilopascals, one must divide by 1000.
One can plug 100 cubic meters into the equation, but the equation is measured in pascals. To find it in the SI unit kilopascals, one must divide by 1000.
Compare your answer with the correct one above
The Ideal Gas Law is as follows:

 is pressure as measured in Pascals,
  is volume as measured in cubic meters,
  is the number of moles of the gas,
  is the gas constant known as 8.314 Joules per mole times Kelvin, and
  is the temperature measured in Kelvin.
A class of students began studying the Ideal Gas Law and how the Pressure and the Volume relate to one another. They took 20 moles of a sample gas and kept the room at a temperature of 300 Kelvin. They then used different sized containers of the gas to limit and expand the volume. At each different volume, they measure the pressure of the gas on its container. The table they made from their results is seen in table 1.
Volume of the container Pressure Measured in Pascals 1 cubic meter 49,884 Pascals 2 cubic meters 24,942 Pascals 3 cubic meters 16,628 Pascals 4 cubic meters 12,471 Pascals 5 cubic meters 9,976.8 Pascals 6 cubic meters 8,314 Pascals 7 cubic meters 7,126.2 Pascals
TABLE 1
And they graph their findings in Figure 1.
FIGURE 1
If the Kelvin temperature were to rise, what would happen to the pressure?
The Ideal Gas Law is as follows:
A class of students began studying the Ideal Gas Law and how the Pressure and the Volume relate to one another. They took 20 moles of a sample gas and kept the room at a temperature of 300 Kelvin. They then used different sized containers of the gas to limit and expand the volume. At each different volume, they measure the pressure of the gas on its container. The table they made from their results is seen in table 1.
| Volume of the container | Pressure Measured in Pascals |
|---|---|
| 1 cubic meter | 49,884 Pascals |
| 2 cubic meters | 24,942 Pascals |
| 3 cubic meters | 16,628 Pascals |
| 4 cubic meters | 12,471 Pascals |
| 5 cubic meters | 9,976.8 Pascals |
| 6 cubic meters | 8,314 Pascals |
| 7 cubic meters | 7,126.2 Pascals |
TABLE 1
And they graph their findings in Figure 1.
FIGURE 1
If the Kelvin temperature were to rise, what would happen to the pressure?
As the temperature increases, the pressure a gas puts on its container increases. Warmer temperature means more molecule movement, which makes the pressure higher.
As the temperature increases, the pressure a gas puts on its container increases. Warmer temperature means more molecule movement, which makes the pressure higher.
Compare your answer with the correct one above
The Ideal Gas Law is as follows:

 is pressure as measured in Pascals,
  is volume as measured in cubic meters,
  is the number of moles of the gas,
  is the gas constant known as 8.314 Joules per mole times Kelvin, and
  is the temperature measured in Kelvin.
A class of students began studying the Ideal Gas Law and how the Pressure and the Volume relate to one another. They took 20 moles of a sample gas and kept the room at a temperature of 300 Kelvin. They then used different sized containers of the gas to limit and expand the volume. At each different volume, they measure the pressure of the gas on its container. The table they made from their results is seen in table 1.
Volume of the container Pressure Measured in Pascals 1 cubic meter 49,884 Pascals 2 cubic meters 24,942 Pascals 3 cubic meters 16,628 Pascals 4 cubic meters 12,471 Pascals 5 cubic meters 9,976.8 Pascals 6 cubic meters 8,314 Pascals 7 cubic meters 7,126.2 Pascals
TABLE 1
And they graph their findings in Figure 1.
FIGURE 1
If the same 20 moles of the same gas were taken to sea level (at a pressure of 100,000 Pascals) and heated to 300 Kelvin, how large would the volume of the container be to hold it at its new pressure?
The Ideal Gas Law is as follows:
A class of students began studying the Ideal Gas Law and how the Pressure and the Volume relate to one another. They took 20 moles of a sample gas and kept the room at a temperature of 300 Kelvin. They then used different sized containers of the gas to limit and expand the volume. At each different volume, they measure the pressure of the gas on its container. The table they made from their results is seen in table 1.
| Volume of the container | Pressure Measured in Pascals |
|---|---|
| 1 cubic meter | 49,884 Pascals |
| 2 cubic meters | 24,942 Pascals |
| 3 cubic meters | 16,628 Pascals |
| 4 cubic meters | 12,471 Pascals |
| 5 cubic meters | 9,976.8 Pascals |
| 6 cubic meters | 8,314 Pascals |
| 7 cubic meters | 7,126.2 Pascals |
TABLE 1
And they graph their findings in Figure 1.
FIGURE 1
If the same 20 moles of the same gas were taken to sea level (at a pressure of 100,000 Pascals) and heated to 300 Kelvin, how large would the volume of the container be to hold it at its new pressure?
Pressure increases as volume decreases. For the gas to be put at the air pressure at sea level, which is approximtely 
") , the volume must decrease. The equation leads us to
, the volume must decrease. The equation leads us to  , or approximately
  .
.
Pressure increases as volume decreases. For the gas to be put at the air pressure at sea level, which is approximtely
Compare your answer with the correct one above
The Ideal Gas Law is as follows:

 is pressure as measured in Pascals,
  is volume as measured in cubic meters,
  is the number of moles of the gas,
  is the gas constant known as 8.314 Joules per mole times Kelvin, and
  is the temperature measured in Kelvin.
A class of students began studying the Ideal Gas Law and how the Pressure and the Volume relate to one another. They took 20 moles of a sample gas and kept the room at a temperature of 300 Kelvin. They then used different sized containers of the gas to limit and expand the volume. At each different volume, they measure the pressure of the gas on its container. The table they made from their results is seen in table 1.
Temperature in Kelvin Pressure Measured in Pascals 200 Kelvin 16, 628 Pascals 400 Kelvin 33, 256 Pascals 600 Kelvin 49, 884 Pascals 800 Kelvin 66, 512 Pascals
TABLE 1
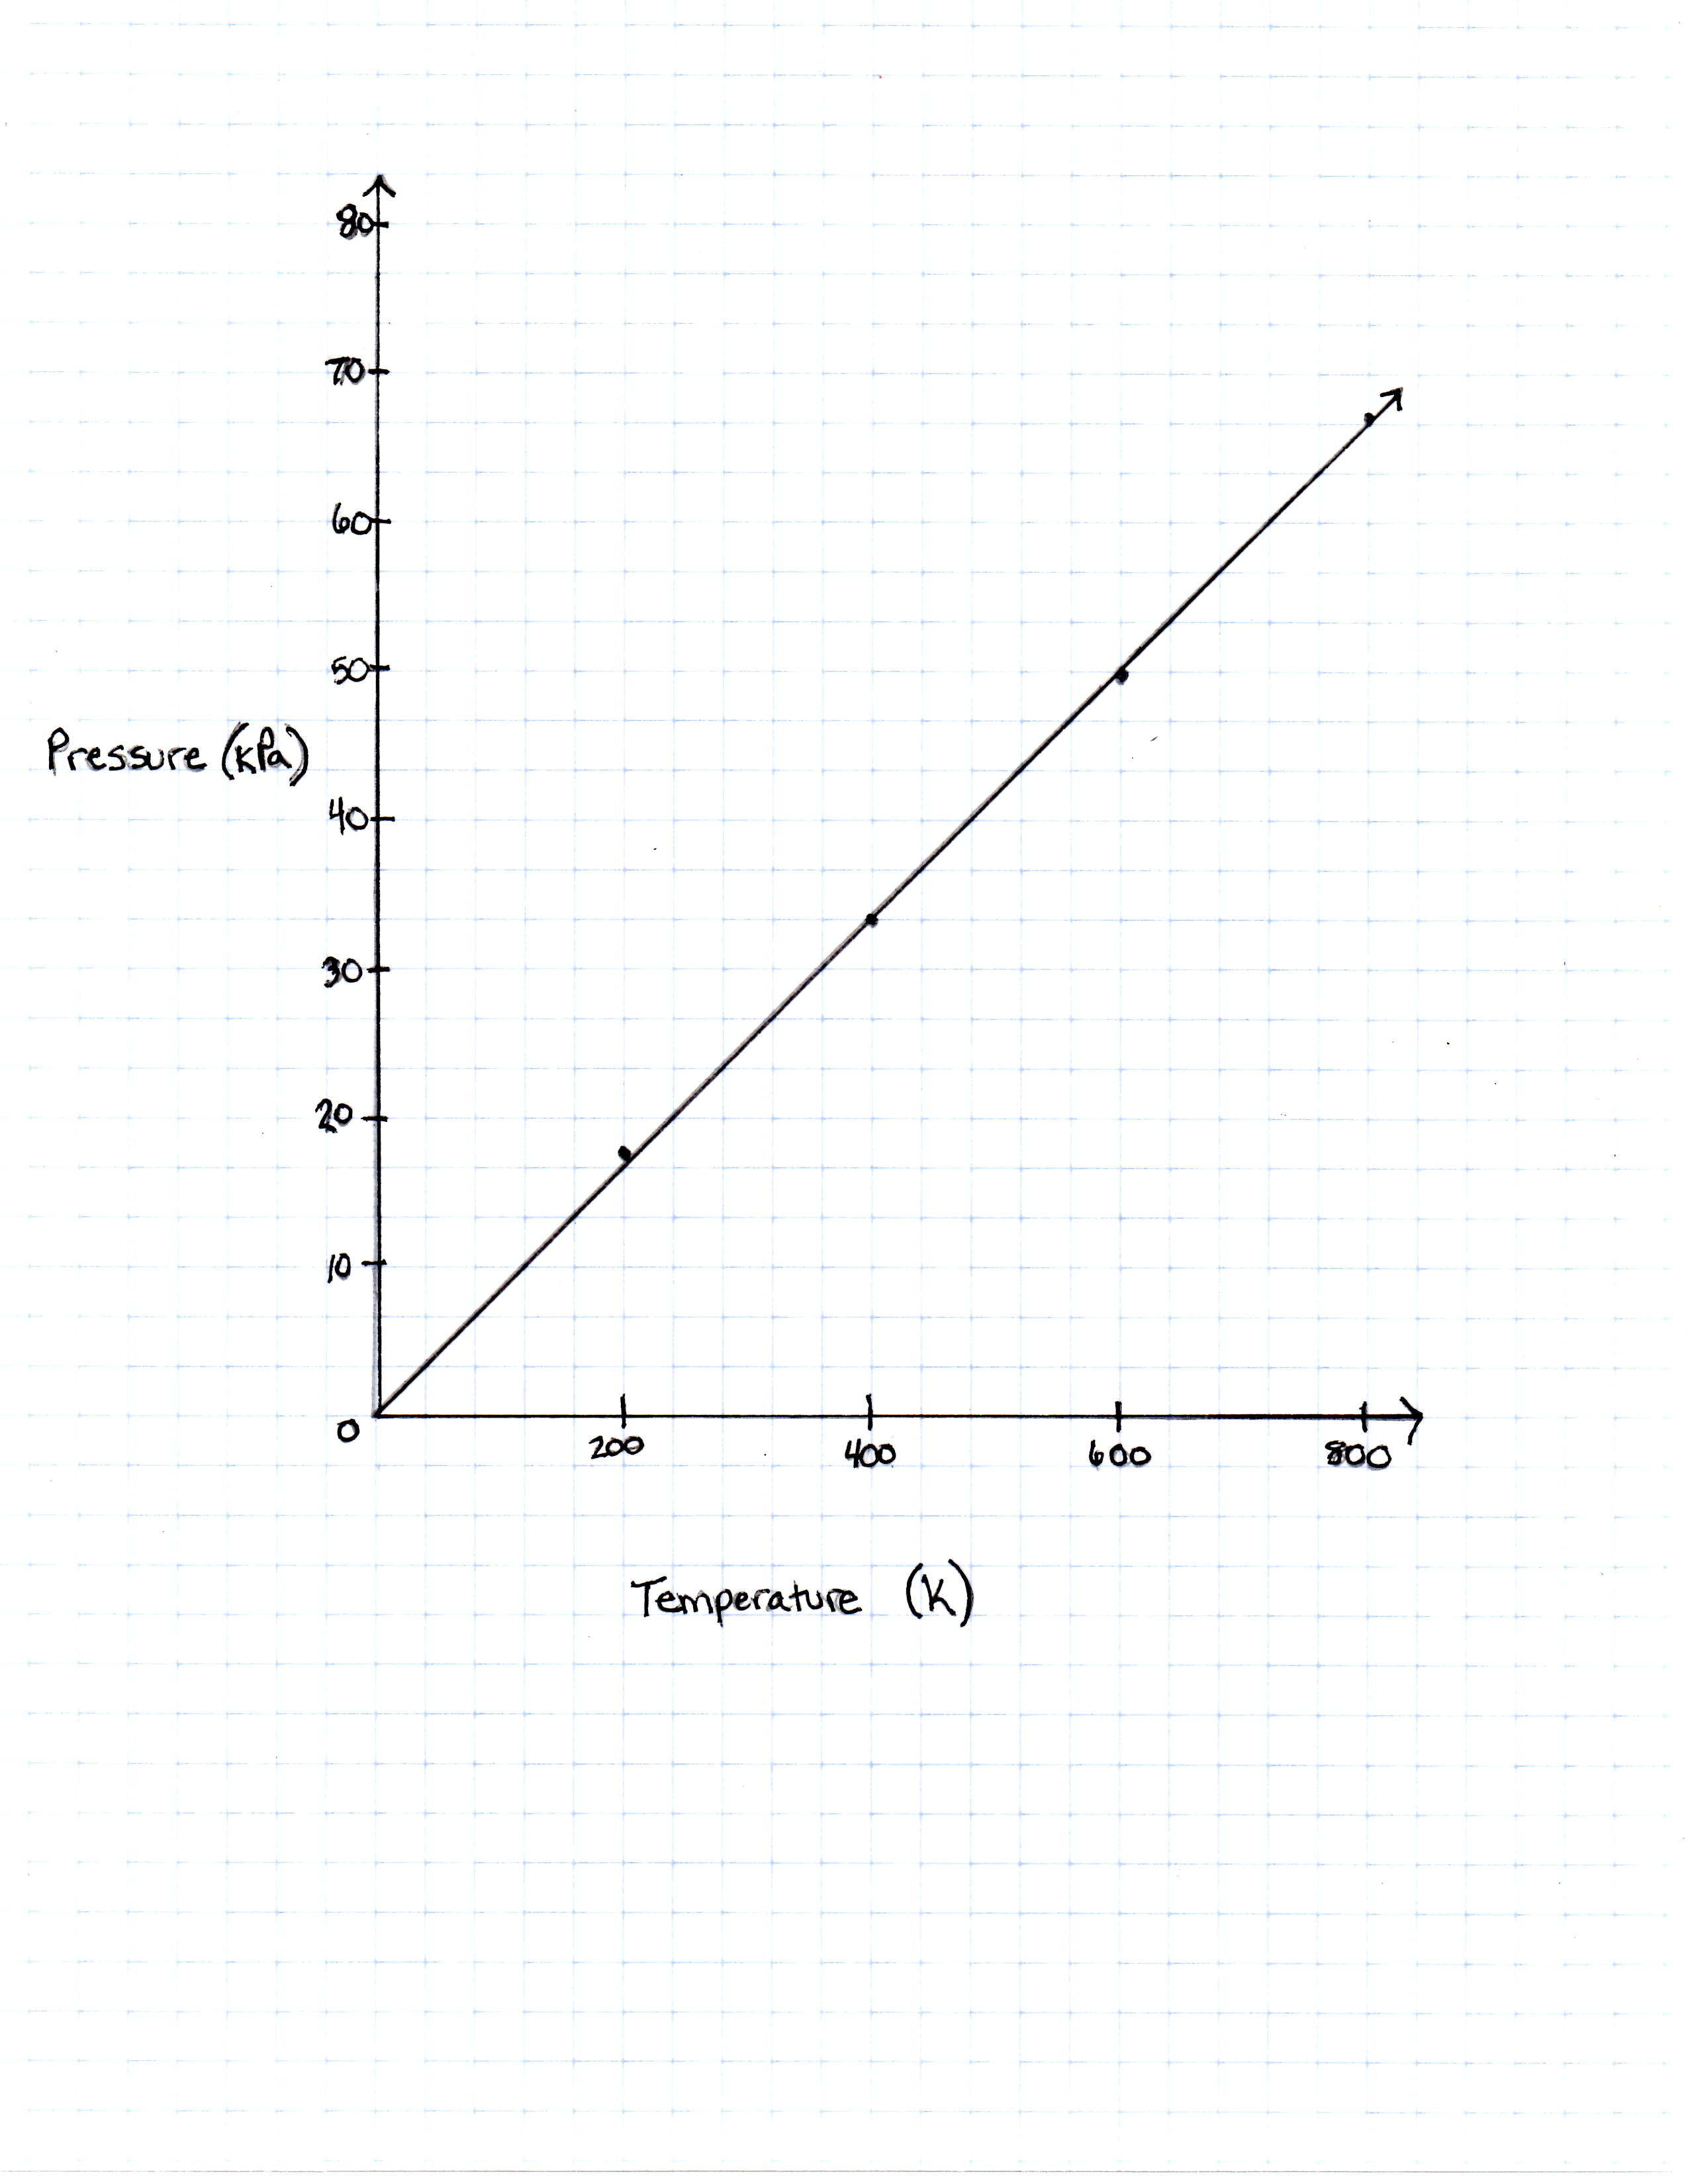
FIGURE 1
The graph the students made based on the data is seen in Figure 1.
Pressure is created by the movement of the gas molecules pushing against a container. 0 Kelvin is known as absolute 0, the temperature at which all molecule movement theoretically stops.
Will the pressure of a gas ever be  according to this graph?
The Ideal Gas Law is as follows:
A class of students began studying the Ideal Gas Law and how the Pressure and the Volume relate to one another. They took 20 moles of a sample gas and kept the room at a temperature of 300 Kelvin. They then used different sized containers of the gas to limit and expand the volume. At each different volume, they measure the pressure of the gas on its container. The table they made from their results is seen in table 1.
| Temperature in Kelvin | Pressure Measured in Pascals |
|---|---|
| 200 Kelvin | 16, 628 Pascals |
| 400 Kelvin | 33, 256 Pascals |
| 600 Kelvin | 49, 884 Pascals |
| 800 Kelvin | 66, 512 Pascals |
TABLE 1
FIGURE 1
The graph the students made based on the data is seen in Figure 1.
Pressure is created by the movement of the gas molecules pushing against a container. 0 Kelvin is known as absolute 0, the temperature at which all molecule movement theoretically stops.
Will the pressure of a gas ever be
The plots on the graph as well as the equation of the Ideal Gas Law do support the idea that when temperature is equal to zero, so is pressure.
The plots on the graph as well as the equation of the Ideal Gas Law do support the idea that when temperature is equal to zero, so is pressure.
Compare your answer with the correct one above
The Ideal Gas Law is as follows:

 is pressure as measured in Pascals,
  is volume as measured in cubic meters,
  is the number of moles of the gas,
  is the gas constant known as 8.314 Joules per mole times Kelvin, and
  is the temperature measured in Kelvin.
A class of students began studying the Ideal Gas Law and how the Pressure and the Volume relate to one another. They took 20 moles of a sample gas and kept the room at a temperature of 300 Kelvin. They then used different sized containers of the gas to limit and expand the volume. At each different volume, they measure the pressure of the gas on its container. The table they made from their results is seen in table 1.
Temperature in Kelvin Pressure Measured in Pascals 200 Kelvin 16, 628 Pascals 400 Kelvin 33, 256 Pascals 600 Kelvin 49, 884 Pascals 800 Kelvin 66, 512 Pascals
TABLE 1
FIGURE 1
The graph the students made based on the data is seen in Figure 1.
Pressure is created by the movement of the gas molecules pushing against a container. 0 Kelvin is known as absolute 0, the temperature at which all molecule movement theoretically stops.
What would the pressure be if the temperature of the gas was increased to 273 Kelvin?
The Ideal Gas Law is as follows:
A class of students began studying the Ideal Gas Law and how the Pressure and the Volume relate to one another. They took 20 moles of a sample gas and kept the room at a temperature of 300 Kelvin. They then used different sized containers of the gas to limit and expand the volume. At each different volume, they measure the pressure of the gas on its container. The table they made from their results is seen in table 1.
| Temperature in Kelvin | Pressure Measured in Pascals |
|---|---|
| 200 Kelvin | 16, 628 Pascals |
| 400 Kelvin | 33, 256 Pascals |
| 600 Kelvin | 49, 884 Pascals |
| 800 Kelvin | 66, 512 Pascals |
TABLE 1
FIGURE 1
The graph the students made based on the data is seen in Figure 1.
Pressure is created by the movement of the gas molecules pushing against a container. 0 Kelvin is known as absolute 0, the temperature at which all molecule movement theoretically stops.
What would the pressure be if the temperature of the gas was increased to 273 Kelvin?
The Ideal Gas Law is given with pressure measured in Pascals. If the number 273 Kelvin was plugged into the equation, the number of Pascals that would be  .
.
(20)/2]273 = 22,697.22") .
.
The Ideal Gas Law is given with pressure measured in Pascals. If the number 273 Kelvin was plugged into the equation, the number of Pascals that would be
Compare your answer with the correct one above
The Ideal Gas Law is as follows:

 is pressure as measured in Pascals,
  is volume as measured in cubic meters,
  is the number of moles of the gas,
  is the gas constant known as 8.314 Joules per mole times Kelvin, and
  is the temperature measured in Kelvin.
A class of students began studying the Ideal Gas Law and how the Pressure and the Volume relate to one another. They took 20 moles of a sample gas and kept the room at a temperature of 300 Kelvin. They then used different sized containers of the gas to limit and expand the volume. At each different volume, they measure the pressure of the gas on its container. The table they made from their results is seen in table 1.
Temperature in Kelvin Pressure Measured in Pascals 200 Kelvin 16, 628 Pascals 400 Kelvin 33, 256 Pascals 600 Kelvin 49, 884 Pascals 800 Kelvin 66, 512 Pascals
TABLE 1
FIGURE 1
The graph the students made based on the data is seen in Figure 1.
Pressure is created by the movement of the gas molecules pushing against a container. 0 Kelvin is known as absolute 0, the temperature at which all molecule movement theoretically stops.
If the equation for converting Kelvin to degrees Fahrenheit is:
 + 32")
at what temperature Fahrenheit is the pressure 
The Ideal Gas Law is as follows:
A class of students began studying the Ideal Gas Law and how the Pressure and the Volume relate to one another. They took 20 moles of a sample gas and kept the room at a temperature of 300 Kelvin. They then used different sized containers of the gas to limit and expand the volume. At each different volume, they measure the pressure of the gas on its container. The table they made from their results is seen in table 1.
| Temperature in Kelvin | Pressure Measured in Pascals |
|---|---|
| 200 Kelvin | 16, 628 Pascals |
| 400 Kelvin | 33, 256 Pascals |
| 600 Kelvin | 49, 884 Pascals |
| 800 Kelvin | 66, 512 Pascals |
TABLE 1
FIGURE 1
The graph the students made based on the data is seen in Figure 1.
Pressure is created by the movement of the gas molecules pushing against a container. 0 Kelvin is known as absolute 0, the temperature at which all molecule movement theoretically stops.
If the equation for converting Kelvin to degrees Fahrenheit is:
at what temperature Fahrenheit is the pressure
When the given number of Pascals is put into the Ideal Gas Law and solved for  , the temperature given is 400 Kelvin. When 400 Kelvin is put in the conversion equation, the degrees farenheit given is 260.6 degrees.
When the given number of Pascals is put into the Ideal Gas Law and solved for
Compare your answer with the correct one above
The Ideal Gas Law is as follows:

 is pressure as measured in Pascals,
  is volume as measured in cubic meters,
  is the number of moles of the gas,
  is the gas constant known as 8.314 Joules per mole times Kelvin, and
  is the temperature measured in Kelvin.
A class of students began studying the Ideal Gas Law and how the Pressure and the Volume relate to one another. They took 20 moles of a sample gas and kept the room at a temperature of 300 Kelvin. They then used different sized containers of the gas to limit and expand the volume. At each different volume, they measure the pressure of the gas on its container. The table they made from their results is seen in table 1.
Temperature in Kelvin Pressure Measured in Pascals 200 Kelvin 16, 628 Pascals 400 Kelvin 33, 256 Pascals 600 Kelvin 49, 884 Pascals 800 Kelvin 66, 512 Pascals
TABLE 1
FIGURE 1
The graph the students made based on the data is seen in Figure 1.
Pressure is created by the movement of the gas molecules pushing against a container. 0 Kelvin is known as absolute 0, the temperature at which all molecule movement theoretically stops.
If the equation that converts temperature Kelvin to temperature in degrees Fahrenheit is
 + 32")
what is the pressure of the sample gas at the freezing point of water, which is 32 degrees Fahrenheit?
The Ideal Gas Law is as follows:
A class of students began studying the Ideal Gas Law and how the Pressure and the Volume relate to one another. They took 20 moles of a sample gas and kept the room at a temperature of 300 Kelvin. They then used different sized containers of the gas to limit and expand the volume. At each different volume, they measure the pressure of the gas on its container. The table they made from their results is seen in table 1.
| Temperature in Kelvin | Pressure Measured in Pascals |
|---|---|
| 200 Kelvin | 16, 628 Pascals |
| 400 Kelvin | 33, 256 Pascals |
| 600 Kelvin | 49, 884 Pascals |
| 800 Kelvin | 66, 512 Pascals |
TABLE 1
FIGURE 1
The graph the students made based on the data is seen in Figure 1.
Pressure is created by the movement of the gas molecules pushing against a container. 0 Kelvin is known as absolute 0, the temperature at which all molecule movement theoretically stops.
If the equation that converts temperature Kelvin to temperature in degrees Fahrenheit is
what is the pressure of the sample gas at the freezing point of water, which is 32 degrees Fahrenheit?
To find the temperature Kelvin to which 32 degrees Fahrenheit correlates, the equation would look like this and one must solve for  :
:
 + 32")
 . Then, this temperature must be put into the Ideal Gas Law and solved for pressure:
(20)}{2}(273)")

To find the temperature Kelvin to which 32 degrees Fahrenheit correlates, the equation would look like this and one must solve for
Compare your answer with the correct one above
The rate of a reversible chemical reaction depends on many factors, including concentrations of the reactants and products, temperature, and presence of enzymes called catalysts. In the forward reaction, two reactants combine to form one product. However, in a reverse reaction, the product is broken down into the two reactants.
In order for a forward reaction to occur, the reactants moving around in the test tube must physically interact with each other. The more often reactants interact with each other, the more produce is formed in the same amount of time. The speed at which reactants combine into products (the rate of the reaction) can be calculated by dividing the amount of a chemical produced in a reaction (often measured in moles) by the time it takes to produce that amount.
In order to determine the effects of reactant and product concentration, temperature, and presence of catalysts on the rate of a reaction, a scientist studied the following reaction:

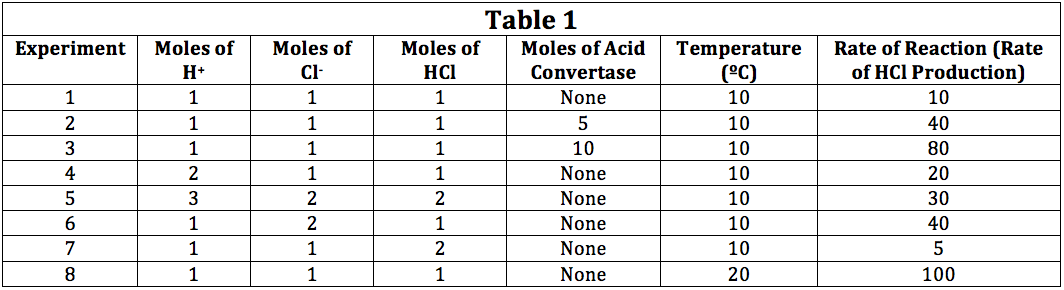
The scientist varied the conditions of the experiment and measured the rate of the reaction. The results are outlined in Table 1. The units of concentration are moles per liter.
In order to display the relationship between the number of moles of H+ and the rate of the reaction in Experiments 1 and 4, the scientist could:
The rate of a reversible chemical reaction depends on many factors, including concentrations of the reactants and products, temperature, and presence of enzymes called catalysts. In the forward reaction, two reactants combine to form one product. However, in a reverse reaction, the product is broken down into the two reactants.
In order for a forward reaction to occur, the reactants moving around in the test tube must physically interact with each other. The more often reactants interact with each other, the more produce is formed in the same amount of time. The speed at which reactants combine into products (the rate of the reaction) can be calculated by dividing the amount of a chemical produced in a reaction (often measured in moles) by the time it takes to produce that amount.
In order to determine the effects of reactant and product concentration, temperature, and presence of catalysts on the rate of a reaction, a scientist studied the following reaction:
The scientist varied the conditions of the experiment and measured the rate of the reaction. The results are outlined in Table 1. The units of concentration are moles per liter.
In order to display the relationship between the number of moles of H+ and the rate of the reaction in Experiments 1 and 4, the scientist could:
The question asks us to determine the best way to show the relationship between the moles of a certain reactant, H+, and the rate of the reaction. The most logical way would be to plot the moles versus the rate, providing a line or bar graph that would show how the rate increased with increasing concentration of the reactant. The other plot set ups do not provide a clear way to show how increasing or decreasing the concentration of a reactant would change the rate.
The question asks us to determine the best way to show the relationship between the moles of a certain reactant, H+, and the rate of the reaction. The most logical way would be to plot the moles versus the rate, providing a line or bar graph that would show how the rate increased with increasing concentration of the reactant. The other plot set ups do not provide a clear way to show how increasing or decreasing the concentration of a reactant would change the rate.
Compare your answer with the correct one above
The rate of a reversible chemical reaction depends on many factors, including concentrations of the reactants and products, temperature, and presence of enzymes called catalysts. In the forward reaction, two reactants combine to form one product. However, in a reverse reaction, the product is broken down into the two reactants.
In order for a forward reaction to occur, the reactants moving around in the test tube must physically interact with each other. The more often reactants interact with each other, the more produce is formed in the same amount of time. The speed at which reactants combine into products (the rate of the reaction) can be calculated by dividing the amount of a chemical produced in a reaction (often measured in moles) by the time it takes to produce that amount.
In order to determine the effects of reactant and product concentration, temperature, and presence of catalysts on the rate of a reaction, a scientist studied the following reaction:

The scientist varied the conditions of the experiment and measured the rate of the reaction. The results are outlined in Table 1. The units of concentration are moles per liter.
The effect of temperature on the rate of reaction is best demonstrated by comparing which two trials?
The rate of a reversible chemical reaction depends on many factors, including concentrations of the reactants and products, temperature, and presence of enzymes called catalysts. In the forward reaction, two reactants combine to form one product. However, in a reverse reaction, the product is broken down into the two reactants.
In order for a forward reaction to occur, the reactants moving around in the test tube must physically interact with each other. The more often reactants interact with each other, the more produce is formed in the same amount of time. The speed at which reactants combine into products (the rate of the reaction) can be calculated by dividing the amount of a chemical produced in a reaction (often measured in moles) by the time it takes to produce that amount.
In order to determine the effects of reactant and product concentration, temperature, and presence of catalysts on the rate of a reaction, a scientist studied the following reaction:
The scientist varied the conditions of the experiment and measured the rate of the reaction. The results are outlined in Table 1. The units of concentration are moles per liter.
The effect of temperature on the rate of reaction is best demonstrated by comparing which two trials?
In Table 1, Trials 1 and 8 have the same number of moles of H+, Cl-, and HCl. Additionally, neither trial contains acid convertase. However, in Trial 8, we can see that the temperature was doubled from that of Trial 1. Thus, Trials 1 and 8 show the relationahip between temperature and reaction rate most clearly.
In Table 1, Trials 1 and 8 have the same number of moles of H+, Cl-, and HCl. Additionally, neither trial contains acid convertase. However, in Trial 8, we can see that the temperature was doubled from that of Trial 1. Thus, Trials 1 and 8 show the relationahip between temperature and reaction rate most clearly.
Compare your answer with the correct one above
The rate of a reversible chemical reaction depends on many factors, including concentrations of the reactants and products, temperature, and presence of enzymes called catalysts. In the forward reaction, two reactants combine to form one product. However, in a reverse reaction, the product is broken down into the two reactants.
In order for a forward reaction to occur, the reactants moving around in the test tube must physically interact with each other. The more often reactants interact with each other, the more produce is formed in the same amount of time. The speed at which reactants combine into products (the rate of the reaction) can be calculated by dividing the amount of a chemical produced in a reaction (often measured in moles) by the time it takes to produce that amount.
In order to determine the effects of reactant and product concentration, temperature, and presence of catalysts on the rate of a reaction, a scientist studied the following reaction:

The scientist varied the conditions of the experiment and measured the rate of the reaction. The results are outlined in Table 1. The units of concentration are moles per liter.
If a scientist desired to produce the most HCl possible in a reaction, the scientist could:
The rate of a reversible chemical reaction depends on many factors, including concentrations of the reactants and products, temperature, and presence of enzymes called catalysts. In the forward reaction, two reactants combine to form one product. However, in a reverse reaction, the product is broken down into the two reactants.
In order for a forward reaction to occur, the reactants moving around in the test tube must physically interact with each other. The more often reactants interact with each other, the more produce is formed in the same amount of time. The speed at which reactants combine into products (the rate of the reaction) can be calculated by dividing the amount of a chemical produced in a reaction (often measured in moles) by the time it takes to produce that amount.
In order to determine the effects of reactant and product concentration, temperature, and presence of catalysts on the rate of a reaction, a scientist studied the following reaction:
The scientist varied the conditions of the experiment and measured the rate of the reaction. The results are outlined in Table 1. The units of concentration are moles per liter.
If a scientist desired to produce the most HCl possible in a reaction, the scientist could:
Using Table 1 as a guide, we can see that the rate of the reaction increases when H+ and Cl- are individually doubled over Trial 1. Thus, it is reasonable to conclude that simultaneously increasing the moles of each of these would further increase the rate. The remaining options all have effects opposite that of maximizing the rate of reaction.
Using Table 1 as a guide, we can see that the rate of the reaction increases when H+ and Cl- are individually doubled over Trial 1. Thus, it is reasonable to conclude that simultaneously increasing the moles of each of these would further increase the rate. The remaining options all have effects opposite that of maximizing the rate of reaction.
Compare your answer with the correct one above
The rate of a reversible chemical reaction depends on many factors, including concentrations of the reactants and products, temperature, and presence of enzymes called catalysts. In the forward reaction, two reactants combine to form one product. However, in a reverse reaction, the product is broken down into the two reactants.
In order for a forward reaction to occur, the reactants moving around in the test tube must physically interact with each other. The more often reactants interact with each other, the more produce is formed in the same amount of time. The speed at which reactants combine into products (the rate of the reaction) can be calculated by dividing the amount of a chemical produced in a reaction (often measured in moles) by the time it takes to produce that amount.
In order to determine the effects of reactant and product concentration, temperature, and presence of catalysts on the rate of a reaction, a scientist studied the following reaction:

The scientist varied the conditions of the experiment and measured the rate of the reaction. The results are outlined in Table 1. The units of concentration are moles per liter.
The direction of the reaction most likely depends on:
The rate of a reversible chemical reaction depends on many factors, including concentrations of the reactants and products, temperature, and presence of enzymes called catalysts. In the forward reaction, two reactants combine to form one product. However, in a reverse reaction, the product is broken down into the two reactants.
In order for a forward reaction to occur, the reactants moving around in the test tube must physically interact with each other. The more often reactants interact with each other, the more produce is formed in the same amount of time. The speed at which reactants combine into products (the rate of the reaction) can be calculated by dividing the amount of a chemical produced in a reaction (often measured in moles) by the time it takes to produce that amount.
In order to determine the effects of reactant and product concentration, temperature, and presence of catalysts on the rate of a reaction, a scientist studied the following reaction:
The scientist varied the conditions of the experiment and measured the rate of the reaction. The results are outlined in Table 1. The units of concentration are moles per liter.
The direction of the reaction most likely depends on:
The passage and Table 1 only describe the rate of formation of HCl, not whether the reaction primarily forms HCl or whether HCl is broken down into H+ and Cl-. Unless the passage described in more detail how HCl was formed, we cannot assume that the direction of the reaction is solely dependent on one of the factors listed in the table. While we can see that the rate of the reaction slows down when more HCl is initially present at the start of the reaction, we do not know if the reaction rate becomes negative at some point (meaning that more HCl is being broken down than formed).
The passage and Table 1 only describe the rate of formation of HCl, not whether the reaction primarily forms HCl or whether HCl is broken down into H+ and Cl-. Unless the passage described in more detail how HCl was formed, we cannot assume that the direction of the reaction is solely dependent on one of the factors listed in the table. While we can see that the rate of the reaction slows down when more HCl is initially present at the start of the reaction, we do not know if the reaction rate becomes negative at some point (meaning that more HCl is being broken down than formed).
Compare your answer with the correct one above
The rate of a reversible chemical reaction depends on many factors, including concentrations of the reactants and products, temperature, and presence of enzymes called catalysts. In the forward reaction, two reactants combine to form one product. However, in a reverse reaction, the product is broken down into the two reactants.
In order for a forward reaction to occur, the reactants moving around in the test tube must physically interact with each other. The more often reactants interact with each other, the more produce is formed in the same amount of time. The speed at which reactants combine into products (the rate of the reaction) can be calculated by dividing the amount of a chemical produced in a reaction (often measured in moles) by the time it takes to produce that amount.
In order to determine the effects of reactant and product concentration, temperature, and presence of catalysts on the rate of a reaction, a scientist studied the following reaction:

The scientist varied the conditions of the experiment and measured the rate of the reaction. The results are outlined in Table 1. The units of concentration are moles per liter.
In Experiment 8, if the moles of H+ were doubled, the expected rate of the reaction would be:
The rate of a reversible chemical reaction depends on many factors, including concentrations of the reactants and products, temperature, and presence of enzymes called catalysts. In the forward reaction, two reactants combine to form one product. However, in a reverse reaction, the product is broken down into the two reactants.
In order for a forward reaction to occur, the reactants moving around in the test tube must physically interact with each other. The more often reactants interact with each other, the more produce is formed in the same amount of time. The speed at which reactants combine into products (the rate of the reaction) can be calculated by dividing the amount of a chemical produced in a reaction (often measured in moles) by the time it takes to produce that amount.
In order to determine the effects of reactant and product concentration, temperature, and presence of catalysts on the rate of a reaction, a scientist studied the following reaction:
The scientist varied the conditions of the experiment and measured the rate of the reaction. The results are outlined in Table 1. The units of concentration are moles per liter.
In Experiment 8, if the moles of H+ were doubled, the expected rate of the reaction would be:
This question asks us to consider what the effect of doubling the moles of H+ would be on the rate of the reaction. However, we must take into consideration that Experiment 8 has a doubled temperature, making the base rate 100. If we consider Experiments 1 and 4, we can see that doubling the H+ concentration doubles the rate. Thus, we could predict that the rate would be somewhere around 200. The only option that fits the predicted value is a rate > 100.
This question asks us to consider what the effect of doubling the moles of H+ would be on the rate of the reaction. However, we must take into consideration that Experiment 8 has a doubled temperature, making the base rate 100. If we consider Experiments 1 and 4, we can see that doubling the H+ concentration doubles the rate. Thus, we could predict that the rate would be somewhere around 200. The only option that fits the predicted value is a rate > 100.
Compare your answer with the correct one above
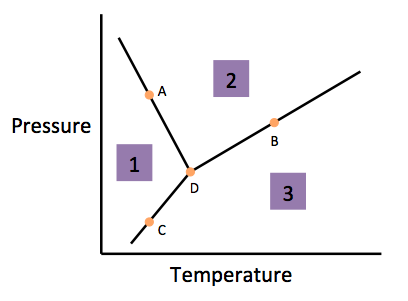
Chemists can model how solids, liquids, and gases behave at different temperatures and pressures with a graph called a phase diagram. When the pressure and temperature are simultaneously known, a scientist can predict whether the material will be in a specific state. The diagram is divided into sections depending on the phase and the lines between sections represent phase transitions occurring between two or more separate phases.
In general, solids of neatly stacked molecules exist when temperatures are low and pressures are intermediate. These values decrease the kinetic energy of the molecules enough to allow for attractive forces to begin the stacking process. Liquids, by contrast, are found at intermediate pressures and temperatures. The temperature is high enough to impart enough kinetic energy to prevent solid formation and the pressure is high enough to prevent the liquid from becoming a gas. Finally, a gas forms at low pressures and high temperatures. The high level of kinetic energy prevents molecules from associating with one another.
Materials can undergo processes called phase transitions, meaning they can transition from one phase to another. The transition from a solid to a liquid is called melting, while the reverse transition is called freezing. Vaporization occurs when a liquid becomes a gas, while condensation occurs when a gas becomes a liquid. Finally, in a process called sublimation, a solid can directly become a gas without passing through a liquid phase. Additionally, when a gas directly becomes a solid, this is known as deposition.
The process as a substance goes from its phase in area one to its new phase in area two is called __________.
Paragraphs two and three in the passage help us answer this question. Using the information contained in paragraph two, we are able to determine that area one corresponds to the solid phase (low temperature and intermediate pressure) and area two corresponds to the liquid phase (intermediate pressures and temperatures). Thus, we are transitioning between the solid and liquid phases. According to paragraph three, this process is called melting.
Paragraphs two and three in the passage help us answer this question. Using the information contained in paragraph two, we are able to determine that area one corresponds to the solid phase (low temperature and intermediate pressure) and area two corresponds to the liquid phase (intermediate pressures and temperatures). Thus, we are transitioning between the solid and liquid phases. According to paragraph three, this process is called melting.
Compare your answer with the correct one above
Chemists can model how solids, liquids, and gases behave at different temperatures and pressures with a graph called a phase diagram. When the pressure and temperature are simultaneously known, a scientist can predict whether the material will be in a specific state. The diagram is divided into sections depending on the phase and the lines between sections represent phase transitions occurring between two or more separate phases.
In general, solids of neatly stacked molecules exist when temperatures are low and pressures are intermediate. These values decrease the kinetic energy of the molecules enough to allow for attractive forces to begin the stacking process. Liquids, by contrast, are found at intermediate pressures and temperatures. The temperature is high enough to impart enough kinetic energy to prevent solid formation and the pressure is high enough to prevent the liquid from becoming a gas. Finally, a gas forms at low pressures and high temperatures. The high level of kinetic energy prevents molecules from associating with one another.
Materials can undergo processes called phase transitions, meaning they can transition from one phase to another. The transition from a solid to a liquid is called melting, while the reverse transition is called freezing. Vaporization occurs when a liquid becomes a gas, while condensation occurs when a gas becomes a liquid. Finally, in a process called sublimation, a solid can directly become a gas without passing through a liquid phase. Additionally, when a gas directly becomes a solid, this is known as deposition.
Which phase transition occurs as a material transitions from area two to area three in the figure?
Using paragraph two, we can determine that area two corresponds to a liquid (intermediate temperatures and pressures) and area three corresoonds to a gas (high temperature and low pressure). According to paragraph three, this process is called vaporization.
Using paragraph two, we can determine that area two corresponds to a liquid (intermediate temperatures and pressures) and area three corresoonds to a gas (high temperature and low pressure). According to paragraph three, this process is called vaporization.
Compare your answer with the correct one above
Chemists can model how solids, liquids, and gases behave at different temperatures and pressures with a graph called a phase diagram. When the pressure and temperature are simultaneously known, a scientist can predict whether the material will be in a specific state. The diagram is divided into sections depending on the phase and the lines between sections represent phase transitions occurring between two or more separate phases.
In general, solids of neatly stacked molecules exist when temperatures are low and pressures are intermediate. These values decrease the kinetic energy of the molecules enough to allow for attractive forces to begin the stacking process. Liquids, by contrast, are found at intermediate pressures and temperatures. The temperature is high enough to impart enough kinetic energy to prevent solid formation and the pressure is high enough to prevent the liquid from becoming a gas. Finally, a gas forms at low pressures and high temperatures. The high level of kinetic energy prevents molecules from associating with one another.
Materials can undergo processes called phase transitions, meaning they can transition from one phase to another. The transition from a solid to a liquid is called melting, while the reverse transition is called freezing. Vaporization occurs when a liquid becomes a gas, while condensation occurs when a gas becomes a liquid. Finally, in a process called sublimation, a solid can directly become a gas without passing through a liquid phase. Additionally, when a gas directly becomes a solid, this is known as deposition.
The phase transition occuring at Point C where a substance moves from area one to area three is called __________.
Paragraph three helps us understand that sublimation occurs when a substance transitions from the solid phase directly to the gaseous phase. Using the information also provided in paragraph two, we can see that area one is where the substance is in solid form (low temperature with intermediate pressure) and area three is where the substance is in gaseous form (high temperature and low pressure).
Paragraph three helps us understand that sublimation occurs when a substance transitions from the solid phase directly to the gaseous phase. Using the information also provided in paragraph two, we can see that area one is where the substance is in solid form (low temperature with intermediate pressure) and area three is where the substance is in gaseous form (high temperature and low pressure).
Compare your answer with the correct one above
Chemists can model how solids, liquids, and gases behave at different temperatures and pressures with a graph called a phase diagram. When the pressure and temperature are simultaneously known, a scientist can predict whether the material will be in a specific state. The diagram is divided into sections depending on the phase and the lines between sections represent phase transitions occurring between two or more separate phases.
In general, solids of neatly stacked molecules exist when temperatures are low and pressures are intermediate. These values decrease the kinetic energy of the molecules enough to allow for attractive forces to begin the stacking process. Liquids, by contrast, are found at intermediate pressures and temperatures. The temperature is high enough to impart enough kinetic energy to prevent solid formation and the pressure is high enough to prevent the liquid from becoming a gas. Finally, a gas forms at low pressures and high temperatures. The high level of kinetic energy prevents molecules from associating with one another.
Materials can undergo processes called phase transitions, meaning they can transition from one phase to another. The transition from a solid to a liquid is called melting, while the reverse transition is called freezing. Vaporization occurs when a liquid becomes a gas, while condensation occurs when a gas becomes a liquid. Finally, in a process called sublimation, a solid can directly become a gas without passing through a liquid phase. Additionally, when a gas directly becomes a solid, this is known as deposition.
The phase transition occuring at Point A where a substance goes from its phase in area two to its phase in area one is best described as __________.
Paragraph three helps us understand that as a material transitions from a liquid to a solid, it is freezing. We can determine that area two is the liquid phase by noting that it is at intermediate pressure and temperature. Additionally, we can determine that area one is a solid by noting the low temperature and intermediate pressure.
Paragraph three helps us understand that as a material transitions from a liquid to a solid, it is freezing. We can determine that area two is the liquid phase by noting that it is at intermediate pressure and temperature. Additionally, we can determine that area one is a solid by noting the low temperature and intermediate pressure.
Compare your answer with the correct one above
Chemists can model how solids, liquids, and gases behave at different temperatures and pressures with a graph called a phase diagram. When the pressure and temperature are simultaneously known, a scientist can predict whether the material will be in a specific state. The diagram is divided into sections depending on the phase and the lines between sections represent phase transitions occurring between two or more separate phases.
In general, solids of neatly stacked molecules exist when temperatures are low and pressures are intermediate. These values decrease the kinetic energy of the molecules enough to allow for attractive forces to begin the stacking process. Liquids, by contrast, are found at intermediate pressures and temperatures. The temperature is high enough to impart enough kinetic energy to prevent solid formation and the pressure is high enough to prevent the liquid from becoming a gas. Finally, a gas forms at low pressures and high temperatures. The high level of kinetic energy prevents molecules from associating with one another.
Materials can undergo processes called phase transitions, meaning they can transition from one phase to another. The transition from a solid to a liquid is called melting, while the reverse transition is called freezing. Vaporization occurs when a liquid becomes a gas, while condensation occurs when a gas becomes a liquid. Finally, in a process called sublimation, a solid can directly become a gas without passing through a liquid phase. Additionally, when a gas directly becomes a solid, this is known as deposition.
At point B, a material is transitioning from its phase in area three to its phase in area two. What is this phase transition called?
From paragraph two, we can see that area three is in the gas phase (high temperature and low pressure) and area two is in the liquid phase (intermediate temperatures and pressures). Thus, we are transitioning from gas to liquid. Paragraph three defines this as condensation.
From paragraph two, we can see that area three is in the gas phase (high temperature and low pressure) and area two is in the liquid phase (intermediate temperatures and pressures). Thus, we are transitioning from gas to liquid. Paragraph three defines this as condensation.
Compare your answer with the correct one above
Chemists can model how solids, liquids, and gases behave at different temperatures and pressures with a graph called a phase diagram. When the pressure and temperature are simultaneously known, a scientist can predict whether the material will be in a specific state. The diagram is divided into sections depending on the phase and the lines between sections represent phase transitions occurring between two or more separate phases.
In general, solids of neatly stacked molecules exist when temperatures are low and pressures are intermediate. These values decrease the kinetic energy of the molecules enough to allow for attractive forces to begin the stacking process. Liquids, by contrast, are found at intermediate pressures and temperatures. The temperature is high enough to impart enough kinetic energy to prevent solid formation and the pressure is high enough to prevent the liquid from becoming a gas. Finally, a gas forms at low pressures and high temperatures. The high level of kinetic energy prevents molecules from associating with one another.
Materials can undergo processes called phase transitions, meaning they can transition from one phase to another. The transition from a solid to a liquid is called melting, while the reverse transition is called freezing. Vaporization occurs when a liquid becomes a gas, while condensation occurs when a gas becomes a liquid. Finally, in a process called sublimation, a solid can directly become a gas without passing through a liquid phase. Additionally, when a gas directly becomes a solid, this is known as deposition.
At Point D, the material is most likley in what phase(s)?
The last sentence of the first paragraph gives us an indication of what Point D may represent. We are told that the lines between sections represents a phase transition occuring between those respective phases. At Point D, however, we see that all three phases intersect, implying that all phase transitions are occuring simulaneously at this point and thus all states of the material may be present.
The last sentence of the first paragraph gives us an indication of what Point D may represent. We are told that the lines between sections represents a phase transition occuring between those respective phases. At Point D, however, we see that all three phases intersect, implying that all phase transitions are occuring simulaneously at this point and thus all states of the material may be present.
Compare your answer with the correct one above
Chemists can model how solids, liquids, and gases behave at different temperatures and pressures with a graph called a phase diagram. When the pressure and temperature are simultaneously known, a scientist can predict whether the material will be in a specific state. The diagram is divided into sections depending on the phase and the lines between sections represent phase transitions occurring between two or more separate phases.
In general, solids of neatly stacked molecules exist when temperatures are low and pressures are intermediate. These values decrease the kinetic energy of the molecules enough to allow for attractive forces to begin the stacking process. Liquids, by contrast, are found at intermediate pressures and temperatures. The temperature is high enough to impart enough kinetic energy to prevent solid formation and the pressure is high enough to prevent the liquid from becoming a gas. Finally, a gas forms at low pressures and high temperatures. The high level of kinetic energy prevents molecules from associating with one another.
Materials can undergo processes called phase transitions, meaning they can transition from one phase to another. The transition from a solid to a liquid is called melting, while the reverse transition is called freezing. Vaporization occurs when a liquid becomes a gas, while condensation occurs when a gas becomes a liquid. Finally, in a process called sublimation, a solid can directly become a gas without passing through a liquid phase. Additionally, when a gas directly becomes a solid, this is known as deposition.
Solid carbon dioxide is commonly stored in freezing cold, low pressure rooms to prevent loss of the material. If the temperature in the room slowly warmed, the solid carbon dioxide would most likely become what?
This question asks us to look at the figure to see what would happen if we keep the pressure constant but increase the temperature of the room storing the dry ice. We can see that as we move left to right across the figure, without changing pressure, that we cross the phase transition line for sublimation/deposition. Becasue the temperature is warming, we know we are going from a solid directly to a gas by the process of sublimation.
This question asks us to look at the figure to see what would happen if we keep the pressure constant but increase the temperature of the room storing the dry ice. We can see that as we move left to right across the figure, without changing pressure, that we cross the phase transition line for sublimation/deposition. Becasue the temperature is warming, we know we are going from a solid directly to a gas by the process of sublimation.
Compare your answer with the correct one above