How to find data representation in earth and space sciences - ACT Science
Card 0 of 20
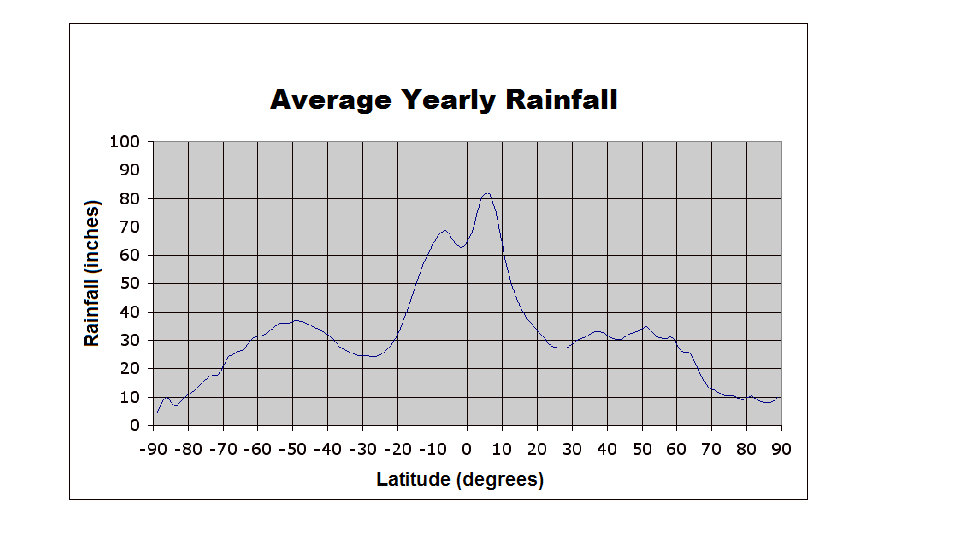
The chart below depicts the average rainfall by location on the Earth. Zero degrees latitude corresponds to the equator. Positive latitudes are north of the equator, while negative latitudes are south of the equator. A latitude with a magnitude of 90 degrees correlates with one of Earth's poles.

Which of the following best describes the rainfall trend shown in the graph?
The chart below depicts the average rainfall by location on the Earth. Zero degrees latitude corresponds to the equator. Positive latitudes are north of the equator, while negative latitudes are south of the equator. A latitude with a magnitude of 90 degrees correlates with one of Earth's poles.
Which of the following best describes the rainfall trend shown in the graph?
Peak rainfall occurs around the equator (zero degrees). The lowest points occur at the poles ( and
and  degrees).
Peak rainfall occurs around the equator (zero degrees). The lowest points occur at the poles (
Compare your answer with the correct one above
The chart below depicts the average rainfall by location on the Earth. Zero degrees latitude corresponds to the equator. Positive latitudes are north of the equator, while negative latitudes are south of the equator. A latitude with a magnitude of 90 degrees correlates with one of Earth's poles.
Which best describes the rainfall trend between thirty and sixty degrees latitude?
Examining the curve of the graph between 20 and 60 degrees, we see that, even though there is slight variation, rainfall hovers around 30 inches. Therefore, we can conclude that these latitudes experiences equal approximate rainfall.
Examining the curve of the graph between 20 and 60 degrees, we see that, even though there is slight variation, rainfall hovers around 30 inches. Therefore, we can conclude that these latitudes experiences equal approximate rainfall.
Compare your answer with the correct one above
The chart below depicts the average rainfall by location on the Earth. Zero degrees latitude corresponds to the equator. Positive latitudes are north of the equator, while negative latitudes are south of the equator. A latitude with a magnitude of 90 degrees correlates with one of Earth's poles.
Which latitude(s) experience(s) an average rainfall of 35 inches?
On the  -axis (Rainfall), locate 35 inches. Find where the curve of the graph intersects this
  -coordinate, and find each corresponding
  -coordinate. There are three:
  ,
,  , and 20 degrees. Although 50 degrees also corresponds to a rainfall of about 35 inches, it is not one of the choices.
On the
Compare your answer with the correct one above
The chart below depicts the average rainfall by location on the Earth. Zero degrees latitude corresponds to the equator. Positive latitudes are north of the equator, while negative latitudes are south of the equator. A latitude with a magnitude of 90 degrees correlates with one of Earth's poles.
The Tropic of Capricorn is about 23.5 degrees south of the equator. Approximately how many more inches of rain does this latitude experience than the North Pole?
To find out the difference in amount of rainfall between these two latitudes, locate  degrees on the
  -axis and find the corresponding amount of rainfall on the
  -axis (25 inches). Next, find the latitude of the North Pole (90 degrees) and its corresponding amount of rainfall (10 inches). Finally, subtract the two to find how much more rain the Tropic of Capricorn receives:
To find out the difference in amount of rainfall between these two latitudes, locate
Compare your answer with the correct one above
Phylogenetics is a tool utilized by evolutionary and molecular biologists to investigate the similarities that exist in the molecular sequences of proteins in varying organisms. The amino acid sequences that build proteins are often used to construct distance matrices that aid in determining evolutionary ties. The study of these matrices helps to expose evolutionary relationships between species that may not have the same phenotypical and existential characteristics.
Study 1
A researcher decides to compare several bat species to several bird and mammalian species in order to determine which two groups were more closely related. The study compares a ghost bat and a tomb bat with two birds, the pigeon and eagle, and two mammals, the spider monkey and macaque. The researcher compared the amino-acid sequences of beta hemoglobin molecules in order to determine whether bats were more related to birds or mammals. Percent similarities of the data were calculated for comparison purposes (Figure 1).
Figure 1

Study 2
A researcher decides to compare a whale to a fish and to several ungulates (hoofed mammals). One set of ungulates that were studied were artiodactyls, meaning they were “even-toed” (hippopotamus and sheep). The other set of ungulates belonged to a class of mammals known as perissodactyls meaning that they were “odd-toed” (rhinoceros and zebra). The researcher compared the amino-acid sequences of beta hemoglobin molecules in order to determine which species were more related to the Minke whale. Percent similarities of the data were calculated for comparison purposes (Figure 2).
Figure 2

Based on the information in Study 1, the ghost bat's beta hemoglobin molecular structure is most similiar to which of the following species?
Phylogenetics is a tool utilized by evolutionary and molecular biologists to investigate the similarities that exist in the molecular sequences of proteins in varying organisms. The amino acid sequences that build proteins are often used to construct distance matrices that aid in determining evolutionary ties. The study of these matrices helps to expose evolutionary relationships between species that may not have the same phenotypical and existential characteristics.
Study 1
A researcher decides to compare several bat species to several bird and mammalian species in order to determine which two groups were more closely related. The study compares a ghost bat and a tomb bat with two birds, the pigeon and eagle, and two mammals, the spider monkey and macaque. The researcher compared the amino-acid sequences of beta hemoglobin molecules in order to determine whether bats were more related to birds or mammals. Percent similarities of the data were calculated for comparison purposes (Figure 1).
Figure 1
Study 2
A researcher decides to compare a whale to a fish and to several ungulates (hoofed mammals). One set of ungulates that were studied were artiodactyls, meaning they were “even-toed” (hippopotamus and sheep). The other set of ungulates belonged to a class of mammals known as perissodactyls meaning that they were “odd-toed” (rhinoceros and zebra). The researcher compared the amino-acid sequences of beta hemoglobin molecules in order to determine which species were more related to the Minke whale. Percent similarities of the data were calculated for comparison purposes (Figure 2).
Figure 2
Based on the information in Study 1, the ghost bat's beta hemoglobin molecular structure is most similiar to which of the following species?
The spider monkey is the correct answer because its hemoglobin content is 91.1% similar to the ghost bat indicated by the information in the distance matrix of Table 1. This information is supported by evidence in the passage.
The spider monkey is the correct answer because its hemoglobin content is 91.1% similar to the ghost bat indicated by the information in the distance matrix of Table 1. This information is supported by evidence in the passage.
Compare your answer with the correct one above
A scientist observes the motion of stars, planets, and other objects in deep space through a high-powered telescope. She observes that these objects all appear to be moving away from the Earth and graphs her results comparing their velocities, in kilometers per second, and their proper distance, in megaparsecs.

A star is measured to have a velocity of

How far away is it?
A scientist observes the motion of stars, planets, and other objects in deep space through a high-powered telescope. She observes that these objects all appear to be moving away from the Earth and graphs her results comparing their velocities, in kilometers per second, and their proper distance, in megaparsecs.
A star is measured to have a velocity of
How far away is it?
Using the graph, we can see that when the velocity is 300 km/s, the distance will be 4.5 megaparsecs.
Using the graph, we can see that when the velocity is 300 km/s, the distance will be 4.5 megaparsecs.
Compare your answer with the correct one above
A scientist observes the motion of stars, planets, and other objects in deep space through a high-powered telescope. She observes that these objects all appear to be moving away from the Earth and graphs her results comparing their velocities, in kilometers per second, and their proper distance, in megaparsecs.
A star is measured to be 12 megaparsecs away. What should its velocity be?
Based on the graph, an object 12 megaparsecs away should have a velocity a little bit more than 800 km/s. The closest answer is 825 km/s.
Based on the graph, an object 12 megaparsecs away should have a velocity a little bit more than 800 km/s. The closest answer is 825 km/s.
Compare your answer with the correct one above
Scientists have long debated the origin of organic molecules on Earth. Organic molecules are those based on the atom carbon, which can form four distinct bonds in contrast to the fewer number allowed in most other non-metals. As a result of this property, carbon can give rise to the enormously complex molecular shapes necessary for life to arise.
Some scientists argue that organic matter was dissolved in water ice on comets, and brought to Earth early in its history. These comets crashed into the early Earth, and deposited carbon-based molecules in copious quantities to the Earth’s surface as their water melted.
In 2014, the first space probe landed on the comet 67P/Churyumov-Gerasimenko. Suppose that scientists find the following information from 5 distinct samples after landing on the comet. Each sample was taken at a single geographical location, but 5 meters deeper than the last. Sample 1 was taken at a depth of 1 meter below the surface.
Sample # Water Ice? Concentration of Organics 1 No N/A 2 Yes 1 mg/L 3 No N/A 4 Yes 4 mg/L 5 Yes 10 mg/L
These samples were compared to 5 similar samples from the surface of Mars. Scientists posited that this comparison would be meaningful because we know that life does not exist on Mars the same way that it does on Earth. Thus, they are comparing a known non-biological celestial body, Mars, with another celestial body, the comet, which may be seeding life on suitable plants.
Sample # Water Ice? Concentration of Organics 1 No N/A 2 No N/A 3 No N/A 4 No N/A 5 Yes 1 mg/L
On the comet, the best description of the relationship between depth of sampling and the concentration of organics is:
Scientists have long debated the origin of organic molecules on Earth. Organic molecules are those based on the atom carbon, which can form four distinct bonds in contrast to the fewer number allowed in most other non-metals. As a result of this property, carbon can give rise to the enormously complex molecular shapes necessary for life to arise.
Some scientists argue that organic matter was dissolved in water ice on comets, and brought to Earth early in its history. These comets crashed into the early Earth, and deposited carbon-based molecules in copious quantities to the Earth’s surface as their water melted.
In 2014, the first space probe landed on the comet 67P/Churyumov-Gerasimenko. Suppose that scientists find the following information from 5 distinct samples after landing on the comet. Each sample was taken at a single geographical location, but 5 meters deeper than the last. Sample 1 was taken at a depth of 1 meter below the surface.
| Sample # | Water Ice? | Concentration of Organics |
|---|---|---|
| 1 | No | N/A |
| 2 | Yes | 1 mg/L |
| 3 | No | N/A |
| 4 | Yes | 4 mg/L |
| 5 | Yes | 10 mg/L |
These samples were compared to 5 similar samples from the surface of Mars. Scientists posited that this comparison would be meaningful because we know that life does not exist on Mars the same way that it does on Earth. Thus, they are comparing a known non-biological celestial body, Mars, with another celestial body, the comet, which may be seeding life on suitable plants.
| Sample # | Water Ice? | Concentration of Organics |
|---|---|---|
| 1 | No | N/A |
| 2 | No | N/A |
| 3 | No | N/A |
| 4 | No | N/A |
| 5 | Yes | 1 mg/L |
On the comet, the best description of the relationship between depth of sampling and the concentration of organics is:
In the first table in the passage, there is a roughly direct relationship between the depth of sampling and the concentration of organic matter in the sample.
In the first table in the passage, there is a roughly direct relationship between the depth of sampling and the concentration of organic matter in the sample.
Compare your answer with the correct one above
Scientists have long debated the origin of organic molecules on Earth. Organic molecules are those based on the atom carbon, which can form four distinct bonds in contrast to the fewer number allowed in most other non-metals. As a result of this property, carbon can give rise to the enormously complex molecular shapes necessary for life to arise.
Some scientists argue that organic matter was dissolved in water ice on comets, and brought to Earth early in its history. These comets crashed into the early Earth, and deposited carbon-based molecules in copious quantities to the Earth’s surface as their water melted.
In 2014, the first space probe landed on the comet 67P/Churyumov-Gerasimenko. Suppose that scientists find the following information from 5 distinct samples after landing on the comet. Each sample was taken at a single geographical location, but 5 meters deeper than the last. Sample 1 was taken at a depth of 1 meter below the surface.
Sample # Water Ice? Concentration of Organics 1 No N/A 2 Yes 1 mg/L 3 No N/A 4 Yes 4 mg/L 5 Yes 10 mg/L
These samples were compared to 5 similar samples from the surface of Mars. Scientists posited that this comparison would be meaningful because we know that life does not exist on Mars the same way that it does on Earth. Thus, they are comparing a known non-biological celestial body, Mars, with another celestial body, the comet, which may be seeding life on suitable plants.
Sample # Water Ice? Concentration of Organics 1 No N/A 2 No N/A 3 No N/A 4 No N/A 5 Yes 1 mg/L
The units expressing the concentration of organic molecules in the samples from Mars and comet are in mg/L. This unit is most precisely a measure of:
Scientists have long debated the origin of organic molecules on Earth. Organic molecules are those based on the atom carbon, which can form four distinct bonds in contrast to the fewer number allowed in most other non-metals. As a result of this property, carbon can give rise to the enormously complex molecular shapes necessary for life to arise.
Some scientists argue that organic matter was dissolved in water ice on comets, and brought to Earth early in its history. These comets crashed into the early Earth, and deposited carbon-based molecules in copious quantities to the Earth’s surface as their water melted.
In 2014, the first space probe landed on the comet 67P/Churyumov-Gerasimenko. Suppose that scientists find the following information from 5 distinct samples after landing on the comet. Each sample was taken at a single geographical location, but 5 meters deeper than the last. Sample 1 was taken at a depth of 1 meter below the surface.
| Sample # | Water Ice? | Concentration of Organics |
|---|---|---|
| 1 | No | N/A |
| 2 | Yes | 1 mg/L |
| 3 | No | N/A |
| 4 | Yes | 4 mg/L |
| 5 | Yes | 10 mg/L |
These samples were compared to 5 similar samples from the surface of Mars. Scientists posited that this comparison would be meaningful because we know that life does not exist on Mars the same way that it does on Earth. Thus, they are comparing a known non-biological celestial body, Mars, with another celestial body, the comet, which may be seeding life on suitable plants.
| Sample # | Water Ice? | Concentration of Organics |
|---|---|---|
| 1 | No | N/A |
| 2 | No | N/A |
| 3 | No | N/A |
| 4 | No | N/A |
| 5 | Yes | 1 mg/L |
The units expressing the concentration of organic molecules in the samples from Mars and comet are in mg/L. This unit is most precisely a measure of:
The unit mg/L is measuring mass (mg) for a certain number of volume units (L). As a result, this expression is a measurement of density.
The unit mg/L is measuring mass (mg) for a certain number of volume units (L). As a result, this expression is a measurement of density.
Compare your answer with the correct one above
Scientists studying historical trends in climate change have a number of tools at their disposal. One method of analyzing paleoclimate data involves the use of fossilized pollen spores embedded in sediment. Pollen spores are specific to the plant that produced them. Because the spores are resilient and are widely-distributed by wind, they provide a snapshot of the vegetation that was widespread at a particular point in time. By identifying the age of a sample and the composition of the various spores, scientists can identify the prominent vegetation and use this information to gain insight into the climate at the time the spores were deposited.
Scientists took sediment samples from various depths of a lakebed. They found that five types of pollen spores make up the majority of spore deposits in each sample. In Table 1, plants are listed along with the respective temperature ranges and levels of precipitation for the areas in which they are commonly found. Table 2 shows the composition of the assortment of spores in each of the four samples taken by the scientists.


Which plant is most tolerant of low levels of precipitation?
Scientists studying historical trends in climate change have a number of tools at their disposal. One method of analyzing paleoclimate data involves the use of fossilized pollen spores embedded in sediment. Pollen spores are specific to the plant that produced them. Because the spores are resilient and are widely-distributed by wind, they provide a snapshot of the vegetation that was widespread at a particular point in time. By identifying the age of a sample and the composition of the various spores, scientists can identify the prominent vegetation and use this information to gain insight into the climate at the time the spores were deposited.
Scientists took sediment samples from various depths of a lakebed. They found that five types of pollen spores make up the majority of spore deposits in each sample. In Table 1, plants are listed along with the respective temperature ranges and levels of precipitation for the areas in which they are commonly found. Table 2 shows the composition of the assortment of spores in each of the four samples taken by the scientists.
Which plant is most tolerant of low levels of precipitation?
Table 1 lists the types of plants. The third column (labeled "Precipitation") shows the annual precipitation where each plant is commonly found. The lowest annual precipitation is associated with Plant E.

Table 1 lists the types of plants. The third column (labeled "Precipitation") shows the annual precipitation where each plant is commonly found. The lowest annual precipitation is associated with Plant E.
Compare your answer with the correct one above
Scientists studying historical trends in climate change have a number of tools at their disposal. One method of analyzing paleoclimate data involves the use of fossilized pollen spores embedded in sediment. Pollen spores are specific to the plant that produced them. Because the spores are resilient and are widely-distributed by wind, they provide a snapshot of the vegetation that was widespread at a particular point in time. By identifying the age of a sample and the composition of the various spores, scientists can identify the prominent vegetation and use this information to gain insight into the climate at the time the spores were deposited.
Scientists took sediment samples from various depths of a lakebed. They found that five types of pollen spores make up the majority of spore deposits in each sample. In Table 1, plants are listed along with the respective temperature ranges and levels of precipitation for the areas in which they are commonly found. Table 2 shows the composition of the assortment of spores in each of the four samples taken by the scientists.
The climate associated with Sample 2 could most likely be described as which of the following?
Information about Sample 2 can be found in Table 2. The most prevalent plant spore for that sample is Plant A.

Based on the information in Table 1, it is evident that Plant A grows best in high temperatures with moderate rainfall.
Information about Sample 2 can be found in Table 2. The most prevalent plant spore for that sample is Plant A.
Based on the information in Table 1, it is evident that Plant A grows best in high temperatures with moderate rainfall.
Compare your answer with the correct one above
Scientists studying historical trends in climate change have a number of tools at their disposal. One method of analyzing paleoclimate data involves the use of fossilized pollen spores embedded in sediment. Pollen spores are specific to the plant that produced them. Because the spores are resilient and are widely-distributed by wind, they provide a snapshot of the vegetation that was widespread at a particular point in time. By identifying the age of a sample and the composition of the various spores, scientists can identify the prominent vegetation and use this information to gain insight into the climate at the time the spores were deposited.
Scientists took sediment samples from various depths of a lakebed. They found that five types of pollen spores make up the majority of spore deposits in each sample. In Table 1, plants are listed along with the respective temperature ranges and levels of precipitation for the areas in which they are commonly found. Table 2 shows the composition of the assortment of spores in each of the four samples taken by the scientists.
Assuming Samples 1 through 4 are arranged chronologically, from oldest to most recent, what can be inferred about the change in temperature across the eras that they cover?
By identifying the predominant type(s) of plant in each sample in Table 2, you can characterize the temperature of each respective era as Warm, Moderate, or Cool.

As shown above, temperature increases between Samples 1 and 2, decreases between Samples 2 and 3, and finally increases slightly between Samples 3 and 4. Because temperature neither increases nor decreases consistently across each era, no pattern can be identified regarding the trend in temperature change.
By identifying the predominant type(s) of plant in each sample in Table 2, you can characterize the temperature of each respective era as Warm, Moderate, or Cool.
As shown above, temperature increases between Samples 1 and 2, decreases between Samples 2 and 3, and finally increases slightly between Samples 3 and 4. Because temperature neither increases nor decreases consistently across each era, no pattern can be identified regarding the trend in temperature change.
Compare your answer with the correct one above
Study 1
A student wishes to study the effects of various household detergents on the mortality of a certain type of bacteria over an extended period of time. She introduces that type of bacteria to four separate agar plates (labeled Plate 1, Plate 2, Plate 3, and Plate 4), and then allows the bacteria to grow for three days. After this period, she treats Plate 1 with water, Plate 2 with Detergent X, Plate 3 with Detergent Y, and Plate 4 with Detergent Z. She then counts the number of bacterial colonies on each plate every eight hours for the next twenty-four hours.
Table 1

Study 2
The student now wishes to compare the effects of Detergent X and Detergent Y on the same type of bacteria as she used in Study 1. The student introduces that type of bacteria to three separate plates (labeled Plate I, Plate II, and Plate III), and then allows the bacteria to grow for 3 days. After this period, she treats Plate I with water, Plate II with Detergent X, and Plate III with Detergent Y. She then counts the number of bacterial colonies on each plate every eight hours for the next forty-eight hours.

In Study 1, which detergent killed the greatest number of bacteria in total during the twenty-four hours of the experiment?
Study 1
A student wishes to study the effects of various household detergents on the mortality of a certain type of bacteria over an extended period of time. She introduces that type of bacteria to four separate agar plates (labeled Plate 1, Plate 2, Plate 3, and Plate 4), and then allows the bacteria to grow for three days. After this period, she treats Plate 1 with water, Plate 2 with Detergent X, Plate 3 with Detergent Y, and Plate 4 with Detergent Z. She then counts the number of bacterial colonies on each plate every eight hours for the next twenty-four hours.
Table 1
Study 2
The student now wishes to compare the effects of Detergent X and Detergent Y on the same type of bacteria as she used in Study 1. The student introduces that type of bacteria to three separate plates (labeled Plate I, Plate II, and Plate III), and then allows the bacteria to grow for 3 days. After this period, she treats Plate I with water, Plate II with Detergent X, and Plate III with Detergent Y. She then counts the number of bacterial colonies on each plate every eight hours for the next forty-eight hours.
In Study 1, which detergent killed the greatest number of bacteria in total during the twenty-four hours of the experiment?
Looking at the table, if we subtract the final number of colonies from the initial number of colonies for each plate, we find that Plate 3 has the largest difference. Plate 3 corresponds to Detergent Y, so Detergent Y killed the greatest number of bacteria in total during the experiment involved in Study 1.
Looking at the table, if we subtract the final number of colonies from the initial number of colonies for each plate, we find that Plate 3 has the largest difference. Plate 3 corresponds to Detergent Y, so Detergent Y killed the greatest number of bacteria in total during the experiment involved in Study 1.
Compare your answer with the correct one above
Study 1
A student wishes to study the effects of various household detergents on the mortality of a certain type of bacteria over an extended period of time. She introduces that type of bacteria to four separate agar plates (labeled Plate 1, Plate 2, Plate 3, and Plate 4), and then allows the bacteria to grow for three days. After this period, she treats Plate 1 with water, Plate 2 with Detergent X, Plate 3 with Detergent Y, and Plate 4 with Detergent Z. She then counts the number of bacterial colonies on each plate every eight hours for the next twenty-four hours.
Table 1
Study 2
The student now wishes to compare the effects of Detergent X and Detergent Y on the same type of bacteria as she used in Study 1. The student introduces that type of bacteria to three separate plates (labeled Plate I, Plate II, and Plate III), and then allows the bacteria to grow for 3 days. After this period, she treats Plate I with water, Plate II with Detergent X, and Plate III with Detergent Y. She then counts the number of bacterial colonies on each plate every eight hours for the next forty-eight hours.
In Study 1, what was the most likely number of bacterial colonies on Plate 4 at 12 hours after the start of the experiment?
From inspection of the table, we see that the number of bacterial colonies on Plate 4 decreases linearly—roughly 20 colonies are killed every eight hours. Knowing this, we can reason that the number of colonies at twelve hours is roughly 50 (about halfway between 42 and 60).
From inspection of the table, we see that the number of bacterial colonies on Plate 4 decreases linearly—roughly 20 colonies are killed every eight hours. Knowing this, we can reason that the number of colonies at twelve hours is roughly 50 (about halfway between 42 and 60).
Compare your answer with the correct one above
Study 1
A student wishes to study the effects of various household detergents on the mortality of a certain type of bacteria over an extended period of time. She introduces that type of bacteria to four separate agar plates (labeled Plate 1, Plate 2, Plate 3, and Plate 4), and then allows the bacteria to grow for three days. After this period, she treats Plate 1 with water, Plate 2 with Detergent X, Plate 3 with Detergent Y, and Plate 4 with Detergent Z. She then counts the number of bacterial colonies on each plate every eight hours for the next twenty-four hours.
Table 1
Study 2
The student now wishes to compare the effects of Detergent X and Detergent Y on the same type of bacteria as she used in Study 1. The student introduces that type of bacteria to three separate plates (labeled Plate I, Plate II, and Plate III), and then allows the bacteria to grow for 3 days. After this period, she treats Plate I with water, Plate II with Detergent X, and Plate III with Detergent Y. She then counts the number of bacterial colonies on each plate every eight hours for the next forty-eight hours.
A student obtains a mystery detergent of unknown identity and decides to perform an experiment with it. He starts with 80 bacterial colonies on a single plate, and observes that only 2 colonies remain at 40 hours following treatment with the detergent. What is the most likely identity of this detergent?
From the graph associated with Study 2, we see that about 2 colonies remain on Plate II roughly 40 hours following treatment. Plate II contains Detergent X.
From the graph associated with Study 2, we see that about 2 colonies remain on Plate II roughly 40 hours following treatment. Plate II contains Detergent X.
Compare your answer with the correct one above
Glaciers move, on average, 1 meter per day, although many are known to move faster or slower depending on their size. Whether they are alpine glaciers, which form high in the mountains, or continental glaciers that cover huge areas of land near the poles, glaciers are responsible for breaking up rock and moving sediment as they move across the land.
Below is a chart of average speed of movement of an alpine glacier per year, as well the amount of sediment displaced by the glacier.
Year Average Glacial Movement Sediment movement per year (tons) 1995 1.1 m/day 2.2 1996 1.3 m/day 2.6 1997 1.5 m/day 3.0 1998 1.3 m/day 2.2 2000 1.1 m/day 1.8 2005 1.0 m/day 1.6 2010 0.9 m/day 1.5
Two scientists have done research on an alpine lake that lies in the path of the glacier. Each took five samples of sediment from the lake.
Scientist 1 believes that the glacier is beginning to melt as it moves lower in elevation, releasing some of the sediment it has carried into mountain streams and springs, causing the makeup of sediments in the lake to change. He notes that the sediment from the lake bed contains brown chert, a rock that can only be found in elevations higher than that of the lake. Scientist 1 took his sample from the sediments that washed ashore on the beach of the lake.
Scientist 2 believes the glacier is not melting, but displacing rock beds so that the sediment loosens and breaks free of the bedrock and then is carried by wind and other erosive elements to the lake. He notes that the sediment from the lake bed contains only trace amounts of the brown chert, not enough to suggest the glacier is melting. Scientist 2 took his samples from sediment deposits at the bottom of the lake.
Below is a chart of the sediment collection samples and the percentage of brown chert found in each.
Sample # Scientist 1: % Brown Chert Scientist 2: % Brown Chert 1 5.2 0.9 2 7.1 1.2 3 6.3 0.4 4 6.5 0.8 5 5.8 1.0
If there are 2000 pounds per ton, how many pounds of sediment, approximately, did the glacier move per day in 1997?
Glaciers move, on average, 1 meter per day, although many are known to move faster or slower depending on their size. Whether they are alpine glaciers, which form high in the mountains, or continental glaciers that cover huge areas of land near the poles, glaciers are responsible for breaking up rock and moving sediment as they move across the land.
Below is a chart of average speed of movement of an alpine glacier per year, as well the amount of sediment displaced by the glacier.
| Year | Average Glacial Movement | Sediment movement per year (tons) |
|---|---|---|
| 1995 | 1.1 m/day | 2.2 |
| 1996 | 1.3 m/day | 2.6 |
| 1997 | 1.5 m/day | 3.0 |
| 1998 | 1.3 m/day | 2.2 |
| 2000 | 1.1 m/day | 1.8 |
| 2005 | 1.0 m/day | 1.6 |
| 2010 | 0.9 m/day | 1.5 |
Two scientists have done research on an alpine lake that lies in the path of the glacier. Each took five samples of sediment from the lake.
Scientist 1 believes that the glacier is beginning to melt as it moves lower in elevation, releasing some of the sediment it has carried into mountain streams and springs, causing the makeup of sediments in the lake to change. He notes that the sediment from the lake bed contains brown chert, a rock that can only be found in elevations higher than that of the lake. Scientist 1 took his sample from the sediments that washed ashore on the beach of the lake.
Scientist 2 believes the glacier is not melting, but displacing rock beds so that the sediment loosens and breaks free of the bedrock and then is carried by wind and other erosive elements to the lake. He notes that the sediment from the lake bed contains only trace amounts of the brown chert, not enough to suggest the glacier is melting. Scientist 2 took his samples from sediment deposits at the bottom of the lake.
Below is a chart of the sediment collection samples and the percentage of brown chert found in each.
| Sample # | Scientist 1: % Brown Chert | Scientist 2: % Brown Chert |
|---|---|---|
| 1 | 5.2 | 0.9 |
| 2 | 7.1 | 1.2 |
| 3 | 6.3 | 0.4 |
| 4 | 6.5 | 0.8 |
| 5 | 5.8 | 1.0 |
If there are 2000 pounds per ton, how many pounds of sediment, approximately, did the glacier move per day in 1997?
In 1997, the glacier moved 3.0 tons of sediment, or 6000 pounds. Simply convert the answer to days instead of years like thus:
6000lbs per year/ 365 days per year = 16.44 pounds per day. The closest answer is 16.5
In 1997, the glacier moved 3.0 tons of sediment, or 6000 pounds. Simply convert the answer to days instead of years like thus:
6000lbs per year/ 365 days per year = 16.44 pounds per day. The closest answer is 16.5
Compare your answer with the correct one above
Glaciers move, on average, 1 meter per day, although many are known to move faster or slower depending on their size. Whether they are alpine glaciers, which form high in the mountains, or continental glaciers that cover huge areas of land near the poles, glaciers are responsible for breaking up rock and moving sediment as they move across the land.
Below is a chart of average speed of movement of an alpine glacier per year, as well the amount of sediment displaced by the glacier.
Year Average Glacial Movement Sediment movement per year (tons) 1995 1.1 m/day 2.2 1996 1.3 m/day 2.6 1997 1.5 m/day 3.0 1998 1.3 m/day 2.2 2000 1.1 m/day 1.8 2005 1.0 m/day 1.6 2010 0.9 m/day 1.5
Two scientists have done research on an alpine lake that lies in the path of the glacier. Each took five samples of sediment from the lake.
Scientist 1 believes that the glacier is beginning to melt as it moves lower in elevation, releasing some of the sediment it has carried into mountain streams and springs, causing the makeup of sediments in the lake to change. He notes that the sediment from the lake bed contains brown chert, a rock that can only be found in elevations higher than that of the lake. Scientist 1 took his sample from the sediments that washed ashore on the beach of the lake.
Scientist 2 believes the glacier is not melting, but displacing rock beds so that the sediment loosens and breaks free of the bedrock and then is carried by wind and other erosive elements to the lake. He notes that the sediment from the lake bed contains only trace amounts of the brown chert, not enough to suggest the glacier is melting. Scientist 2 took his samples from sediment deposits at the bottom of the lake.
Below is a chart of the sediment collection samples and the percentage of brown chert found in each.
Sample # Scientist 1: % Brown Chert Scientist 2: % Brown Chert 1 5.2 0.9 2 7.1 1.2 3 6.3 0.4 4 6.5 0.8 5 5.8 1.0
What could account for the slow decrease in average movement per year since 1998?
Glaciers move, on average, 1 meter per day, although many are known to move faster or slower depending on their size. Whether they are alpine glaciers, which form high in the mountains, or continental glaciers that cover huge areas of land near the poles, glaciers are responsible for breaking up rock and moving sediment as they move across the land.
Below is a chart of average speed of movement of an alpine glacier per year, as well the amount of sediment displaced by the glacier.
| Year | Average Glacial Movement | Sediment movement per year (tons) |
|---|---|---|
| 1995 | 1.1 m/day | 2.2 |
| 1996 | 1.3 m/day | 2.6 |
| 1997 | 1.5 m/day | 3.0 |
| 1998 | 1.3 m/day | 2.2 |
| 2000 | 1.1 m/day | 1.8 |
| 2005 | 1.0 m/day | 1.6 |
| 2010 | 0.9 m/day | 1.5 |
Two scientists have done research on an alpine lake that lies in the path of the glacier. Each took five samples of sediment from the lake.
Scientist 1 believes that the glacier is beginning to melt as it moves lower in elevation, releasing some of the sediment it has carried into mountain streams and springs, causing the makeup of sediments in the lake to change. He notes that the sediment from the lake bed contains brown chert, a rock that can only be found in elevations higher than that of the lake. Scientist 1 took his sample from the sediments that washed ashore on the beach of the lake.
Scientist 2 believes the glacier is not melting, but displacing rock beds so that the sediment loosens and breaks free of the bedrock and then is carried by wind and other erosive elements to the lake. He notes that the sediment from the lake bed contains only trace amounts of the brown chert, not enough to suggest the glacier is melting. Scientist 2 took his samples from sediment deposits at the bottom of the lake.
Below is a chart of the sediment collection samples and the percentage of brown chert found in each.
| Sample # | Scientist 1: % Brown Chert | Scientist 2: % Brown Chert |
|---|---|---|
| 1 | 5.2 | 0.9 |
| 2 | 7.1 | 1.2 |
| 3 | 6.3 | 0.4 |
| 4 | 6.5 | 0.8 |
| 5 | 5.8 | 1.0 |
What could account for the slow decrease in average movement per year since 1998?
All of the answers are possibilties, but the idea that the glacier could be melting is the best. Glaciers move so slowly and are so heavy that objects in the way or leveling of the ground would not affect movement. The only thing that would would be a change in the mass of the glacier itself and melting would decrease the mass and therefore the momentum of the glacier.
All of the answers are possibilties, but the idea that the glacier could be melting is the best. Glaciers move so slowly and are so heavy that objects in the way or leveling of the ground would not affect movement. The only thing that would would be a change in the mass of the glacier itself and melting would decrease the mass and therefore the momentum of the glacier.
Compare your answer with the correct one above
Glaciers move, on average, 1 meter per day, although many are known to move faster or slower depending on their size. Whether they are alpine glaciers, which form high in the mountains, or continental glaciers that cover huge areas of land near the poles, glaciers are responsible for breaking up rock and moving sediment as they move across the land.
Below is a chart of average speed of movement of an alpine glacier per year, as well the amount of sediment displaced by the glacier.
Year Average Glacial Movement Sediment movement per year (tons) 1995 1.1 m/day 2.2 1996 1.3 m/day 2.6 1997 1.5 m/day 3.0 1998 1.3 m/day 2.2 2000 1.1 m/day 1.8 2005 1.0 m/day 1.6 2010 0.9 m/day 1.5
Two scientists have done research on an alpine lake that lies in the path of the glacier. Each took five samples of sediment from the lake.
Scientist 1 believes that the glacier is beginning to melt as it moves lower in elevation, releasing some of the sediment it has carried into mountain streams and springs, causing the makeup of sediments in the lake to change. He notes that the sediment from the lake bed contains brown chert, a rock that can only be found in elevations higher than that of the lake. Scientist 1 took his sample from the sediments that washed ashore on the beach of the lake.
Scientist 2 believes the glacier is not melting, but displacing rock beds so that the sediment loosens and breaks free of the bedrock and then is carried by wind and other erosive elements to the lake. He notes that the sediment from the lake bed contains only trace amounts of the brown chert, not enough to suggest the glacier is melting. Scientist 2 took his samples from sediment deposits at the bottom of the lake.
Below is a chart of the sediment collection samples and the percentage of brown chert found in each.
Sample # Scientist 1: % Brown Chert Scientist 2: % Brown Chert 1 5.2 0.9 2 7.1 1.2 3 6.3 0.4 4 6.5 0.8 5 5.8 1.0
What do you predict will be the average movement per year of the glacier in 2020?
Glaciers move, on average, 1 meter per day, although many are known to move faster or slower depending on their size. Whether they are alpine glaciers, which form high in the mountains, or continental glaciers that cover huge areas of land near the poles, glaciers are responsible for breaking up rock and moving sediment as they move across the land.
Below is a chart of average speed of movement of an alpine glacier per year, as well the amount of sediment displaced by the glacier.
| Year | Average Glacial Movement | Sediment movement per year (tons) |
|---|---|---|
| 1995 | 1.1 m/day | 2.2 |
| 1996 | 1.3 m/day | 2.6 |
| 1997 | 1.5 m/day | 3.0 |
| 1998 | 1.3 m/day | 2.2 |
| 2000 | 1.1 m/day | 1.8 |
| 2005 | 1.0 m/day | 1.6 |
| 2010 | 0.9 m/day | 1.5 |
Two scientists have done research on an alpine lake that lies in the path of the glacier. Each took five samples of sediment from the lake.
Scientist 1 believes that the glacier is beginning to melt as it moves lower in elevation, releasing some of the sediment it has carried into mountain streams and springs, causing the makeup of sediments in the lake to change. He notes that the sediment from the lake bed contains brown chert, a rock that can only be found in elevations higher than that of the lake. Scientist 1 took his sample from the sediments that washed ashore on the beach of the lake.
Scientist 2 believes the glacier is not melting, but displacing rock beds so that the sediment loosens and breaks free of the bedrock and then is carried by wind and other erosive elements to the lake. He notes that the sediment from the lake bed contains only trace amounts of the brown chert, not enough to suggest the glacier is melting. Scientist 2 took his samples from sediment deposits at the bottom of the lake.
Below is a chart of the sediment collection samples and the percentage of brown chert found in each.
| Sample # | Scientist 1: % Brown Chert | Scientist 2: % Brown Chert |
|---|---|---|
| 1 | 5.2 | 0.9 |
| 2 | 7.1 | 1.2 |
| 3 | 6.3 | 0.4 |
| 4 | 6.5 | 0.8 |
| 5 | 5.8 | 1.0 |
What do you predict will be the average movement per year of the glacier in 2020?
The speed of the glacier has steadily been decreasing for over a decade. Following the pattern of an approximately 0.1 m/day decrease every five years or so, the speed of the glacier in 2020 would be around 0.7 m/day
The speed of the glacier has steadily been decreasing for over a decade. Following the pattern of an approximately 0.1 m/day decrease every five years or so, the speed of the glacier in 2020 would be around 0.7 m/day
Compare your answer with the correct one above
Glaciers move, on average, 1 meter per day, although many are known to move faster or slower depending on their size. Whether they are alpine glaciers, which form high in the mountains, or continental glaciers that cover huge areas of land near the poles, glaciers are responsible for breaking up rock and moving sediment as they move across the land.
Below is a chart of average speed of movement of an alpine glacier per year, as well the amount of sediment displaced by the glacier.
Year Average Glacial Movement Sediment movement per year (tons) 1995 1.1 m/day 2.2 1996 1.3 m/day 2.6 1997 1.5 m/day 3.0 1998 1.3 m/day 2.2 2000 1.1 m/day 1.8 2005 1.0 m/day 1.6 2010 0.9 m/day 1.5
Two scientists have done research on an alpine lake that lies in the path of the glacier. Each took five samples of sediment from the lake.
Scientist 1 believes that the glacier is beginning to melt as it moves lower in elevation, releasing some of the sediment it has carried into mountain streams and springs, causing the makeup of sediments in the lake to change. He notes that the sediment from the lake bed contains brown chert, a rock that can only be found in elevations higher than that of the lake. Scientist 1 took his sample from the sediments that washed ashore on the beach of the lake.
Scientist 2 believes the glacier is not melting, but displacing rock beds so that the sediment loosens and breaks free of the bedrock and then is carried by wind and other erosive elements to the lake. He notes that the sediment from the lake bed contains only trace amounts of the brown chert, not enough to suggest the glacier is melting. Scientist 2 took his samples from sediment deposits at the bottom of the lake.
Below is a chart of the sediment collection samples and the percentage of brown chert found in each.
Sample # Scientist 1: % Brown Chert Scientist 2: % Brown Chert 1 5.2 0.9 2 7.1 1.2 3 6.3 0.4 4 6.5 0.8 5 5.8 1.0
What is the approximate relationship between the speed of the glacier and the amount of sediment displaced each year?
Glaciers move, on average, 1 meter per day, although many are known to move faster or slower depending on their size. Whether they are alpine glaciers, which form high in the mountains, or continental glaciers that cover huge areas of land near the poles, glaciers are responsible for breaking up rock and moving sediment as they move across the land.
Below is a chart of average speed of movement of an alpine glacier per year, as well the amount of sediment displaced by the glacier.
| Year | Average Glacial Movement | Sediment movement per year (tons) |
|---|---|---|
| 1995 | 1.1 m/day | 2.2 |
| 1996 | 1.3 m/day | 2.6 |
| 1997 | 1.5 m/day | 3.0 |
| 1998 | 1.3 m/day | 2.2 |
| 2000 | 1.1 m/day | 1.8 |
| 2005 | 1.0 m/day | 1.6 |
| 2010 | 0.9 m/day | 1.5 |
Two scientists have done research on an alpine lake that lies in the path of the glacier. Each took five samples of sediment from the lake.
Scientist 1 believes that the glacier is beginning to melt as it moves lower in elevation, releasing some of the sediment it has carried into mountain streams and springs, causing the makeup of sediments in the lake to change. He notes that the sediment from the lake bed contains brown chert, a rock that can only be found in elevations higher than that of the lake. Scientist 1 took his sample from the sediments that washed ashore on the beach of the lake.
Scientist 2 believes the glacier is not melting, but displacing rock beds so that the sediment loosens and breaks free of the bedrock and then is carried by wind and other erosive elements to the lake. He notes that the sediment from the lake bed contains only trace amounts of the brown chert, not enough to suggest the glacier is melting. Scientist 2 took his samples from sediment deposits at the bottom of the lake.
Below is a chart of the sediment collection samples and the percentage of brown chert found in each.
| Sample # | Scientist 1: % Brown Chert | Scientist 2: % Brown Chert |
|---|---|---|
| 1 | 5.2 | 0.9 |
| 2 | 7.1 | 1.2 |
| 3 | 6.3 | 0.4 |
| 4 | 6.5 | 0.8 |
| 5 | 5.8 | 1.0 |
What is the approximate relationship between the speed of the glacier and the amount of sediment displaced each year?
On average, as the speed of the glacier increases or decreases, so does the amount of sediment displaced, indicating that the amount of sediment displaced is directly related to the speed of the glacier.
On average, as the speed of the glacier increases or decreases, so does the amount of sediment displaced, indicating that the amount of sediment displaced is directly related to the speed of the glacier.
Compare your answer with the correct one above

Above is the deer population of Routt County National Forest between 1905 and 2005. The First White-tail deer were introduced to the forest for hunting in 1905. They are not native to the area, though they thrived in the environment.
White tailed deer eat the seeds of coniferous trees, berries, and an assortment of other plants. They tend to roam in small family herds and stick to areas where water is abundant and is unlikely to freeze completely in the winter.
In 1995, an environmental scientist watched a small herd of deer for ten days, recording their movements and taking note of herd size and stopping place. Below is a chart of his results.
Day Travel distance (mi) Herd size Stopping place 1 21 13 Bear Creek 2 15 13 Yampa Valley 5 19 13 Bear Creek 8 11 10 Gilpin Lake 10 22 10 Yampa Valley
Aproximately how many deer per year were added to the population between 1905 and 1920, assuming 1905 marks the 'zero hour' when the deer were first introduced?
Above is the deer population of Routt County National Forest between 1905 and 2005. The First White-tail deer were introduced to the forest for hunting in 1905. They are not native to the area, though they thrived in the environment.
White tailed deer eat the seeds of coniferous trees, berries, and an assortment of other plants. They tend to roam in small family herds and stick to areas where water is abundant and is unlikely to freeze completely in the winter.
In 1995, an environmental scientist watched a small herd of deer for ten days, recording their movements and taking note of herd size and stopping place. Below is a chart of his results.
| Day | Travel distance (mi) | Herd size | Stopping place |
|---|---|---|---|
| 1 | 21 | 13 | Bear Creek |
| 2 | 15 | 13 | Yampa Valley |
| 5 | 19 | 13 | Bear Creek |
| 8 | 11 | 10 | Gilpin Lake |
| 10 | 22 | 10 | Yampa Valley |
Aproximately how many deer per year were added to the population between 1905 and 1920, assuming 1905 marks the 'zero hour' when the deer were first introduced?
After 15 years the deer population peaked for the first time at around 260,000 deer. 260,000 deer total / 15 years= 17,333. The closest answer is 17,300.
After 15 years the deer population peaked for the first time at around 260,000 deer. 260,000 deer total / 15 years= 17,333. The closest answer is 17,300.
Compare your answer with the correct one above