How to find data representation in chemistry - ACT Science
Card 0 of 20
The significant increase in atmospheric carbon dioxide since pre-industrial levels can be seen in the world’s oceans which absorb the CO2 and in turn undergo changes in chemistry. The consequences of increased CO2 include acidification of seawater and a decrease in carbonate ion (CO32-) concentration.
Changes in seawater chemistry affect marine organisms. The early life stages of invertebrates, such as squid, may be particularly vulnerable to changes in carbon dioxide levels. Acting as both predator and prey, squid are a significant component of marine ecosystems. For example, fish and sea birds, such as tuna and albatross, are dependent on squid as a source of prey. Furthermore, the fishing industry is impacted by the health of squid populations. California fisheries produce the majority of market squid.
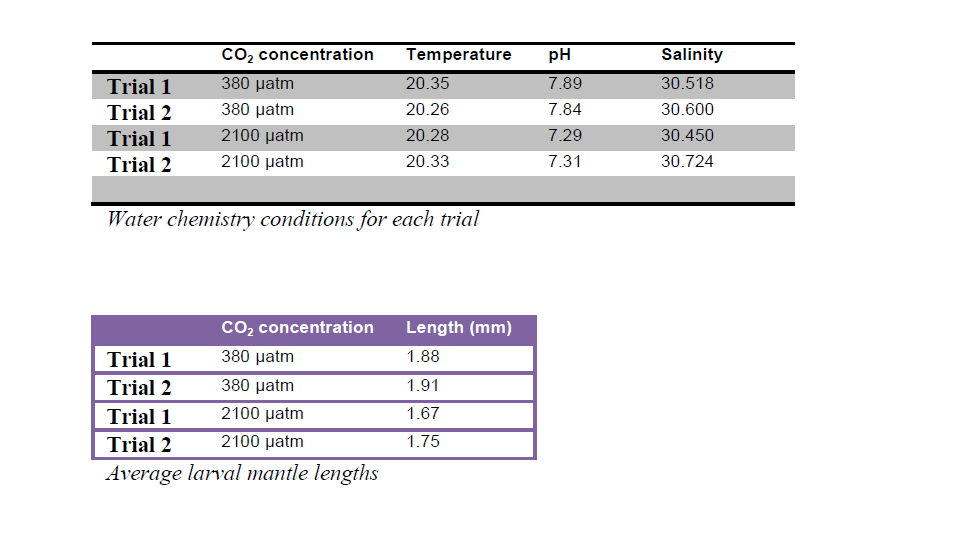
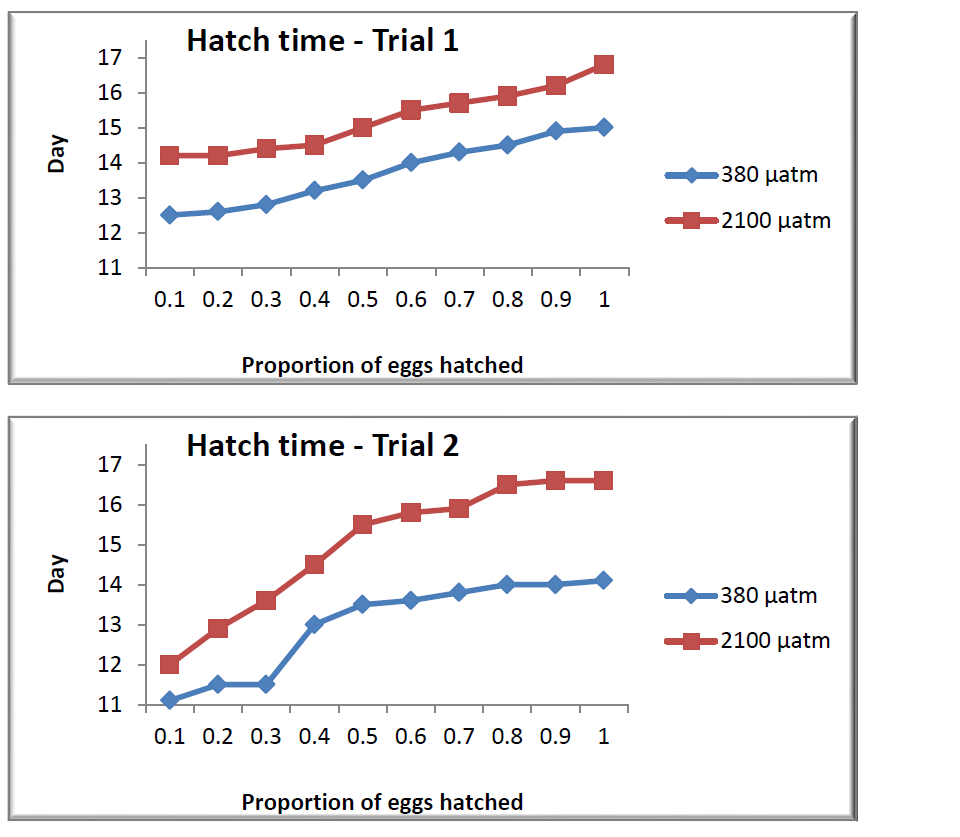
In order to determine how increased levels of carbon dioxide affect the development of squid, eggs were hatched in two different conditions: normal (380 µatm) and elevated (2100 µatm) levels of CO2. The time to hatch and the size of the larval mantle (the anatomical feature that includes the body wall and fins) were measured and recorded. Two trials were conducted for each carbon dioxide concentration.
Which of the following can be concluded from the passage?
The significant increase in atmospheric carbon dioxide since pre-industrial levels can be seen in the world’s oceans which absorb the CO2 and in turn undergo changes in chemistry. The consequences of increased CO2 include acidification of seawater and a decrease in carbonate ion (CO32-) concentration.
Changes in seawater chemistry affect marine organisms. The early life stages of invertebrates, such as squid, may be particularly vulnerable to changes in carbon dioxide levels. Acting as both predator and prey, squid are a significant component of marine ecosystems. For example, fish and sea birds, such as tuna and albatross, are dependent on squid as a source of prey. Furthermore, the fishing industry is impacted by the health of squid populations. California fisheries produce the majority of market squid.
In order to determine how increased levels of carbon dioxide affect the development of squid, eggs were hatched in two different conditions: normal (380 µatm) and elevated (2100 µatm) levels of CO2. The time to hatch and the size of the larval mantle (the anatomical feature that includes the body wall and fins) were measured and recorded. Two trials were conducted for each carbon dioxide concentration.
Which of the following can be concluded from the passage?
Looking at the information given, the only conclusion that can be drawn is that atmospheric carbon dioxide levels correlate with ocean carbon dioxide levels. This is evident from the first sentence of the passage: "The significant increase in atmospheric carbon dioxide since pre-industrial levels can be seen in the world’s oceans which absorb the CO2 and in turn undergo changes in chemistry."
Looking at the information given, the only conclusion that can be drawn is that atmospheric carbon dioxide levels correlate with ocean carbon dioxide levels. This is evident from the first sentence of the passage: "The significant increase in atmospheric carbon dioxide since pre-industrial levels can be seen in the world’s oceans which absorb the CO2 and in turn undergo changes in chemistry."
Compare your answer with the correct one above
The Ideal Gas Law is as follows:

 is pressure as measured in Pascals,
  is volume as measured in cubic meters,
  is the number of moles of the gas,
  is the gas constant known as 8.314 Joules per mole times Kelvin, and
  is the temperature measured in Kelvin.
A class of students began studying the Ideal Gas Law and how the Pressure and the Volume relate to one another. They took 20 moles of a sample gas and kept the room at a temperature of 300 Kelvin. They then used different sized containers of the gas to limit and expand the volume. At each different volume, they measure the pressure of the gas on its container. The table they made from their results is seen in table 1.
Volume of the container Pressure Measured in Pascals 1 cubic meter 49,884 Pascals 2 cubic meters 24,942 Pascals 3 cubic meters 16,628 Pascals 4 cubic meters 12,471 Pascals 5 cubic meters 9,976.8 Pascals 6 cubic meters 8,314 Pascals 7 cubic meters 7,126.2 Pascals
TABLE 1
And they graph their findings in Figure 1.
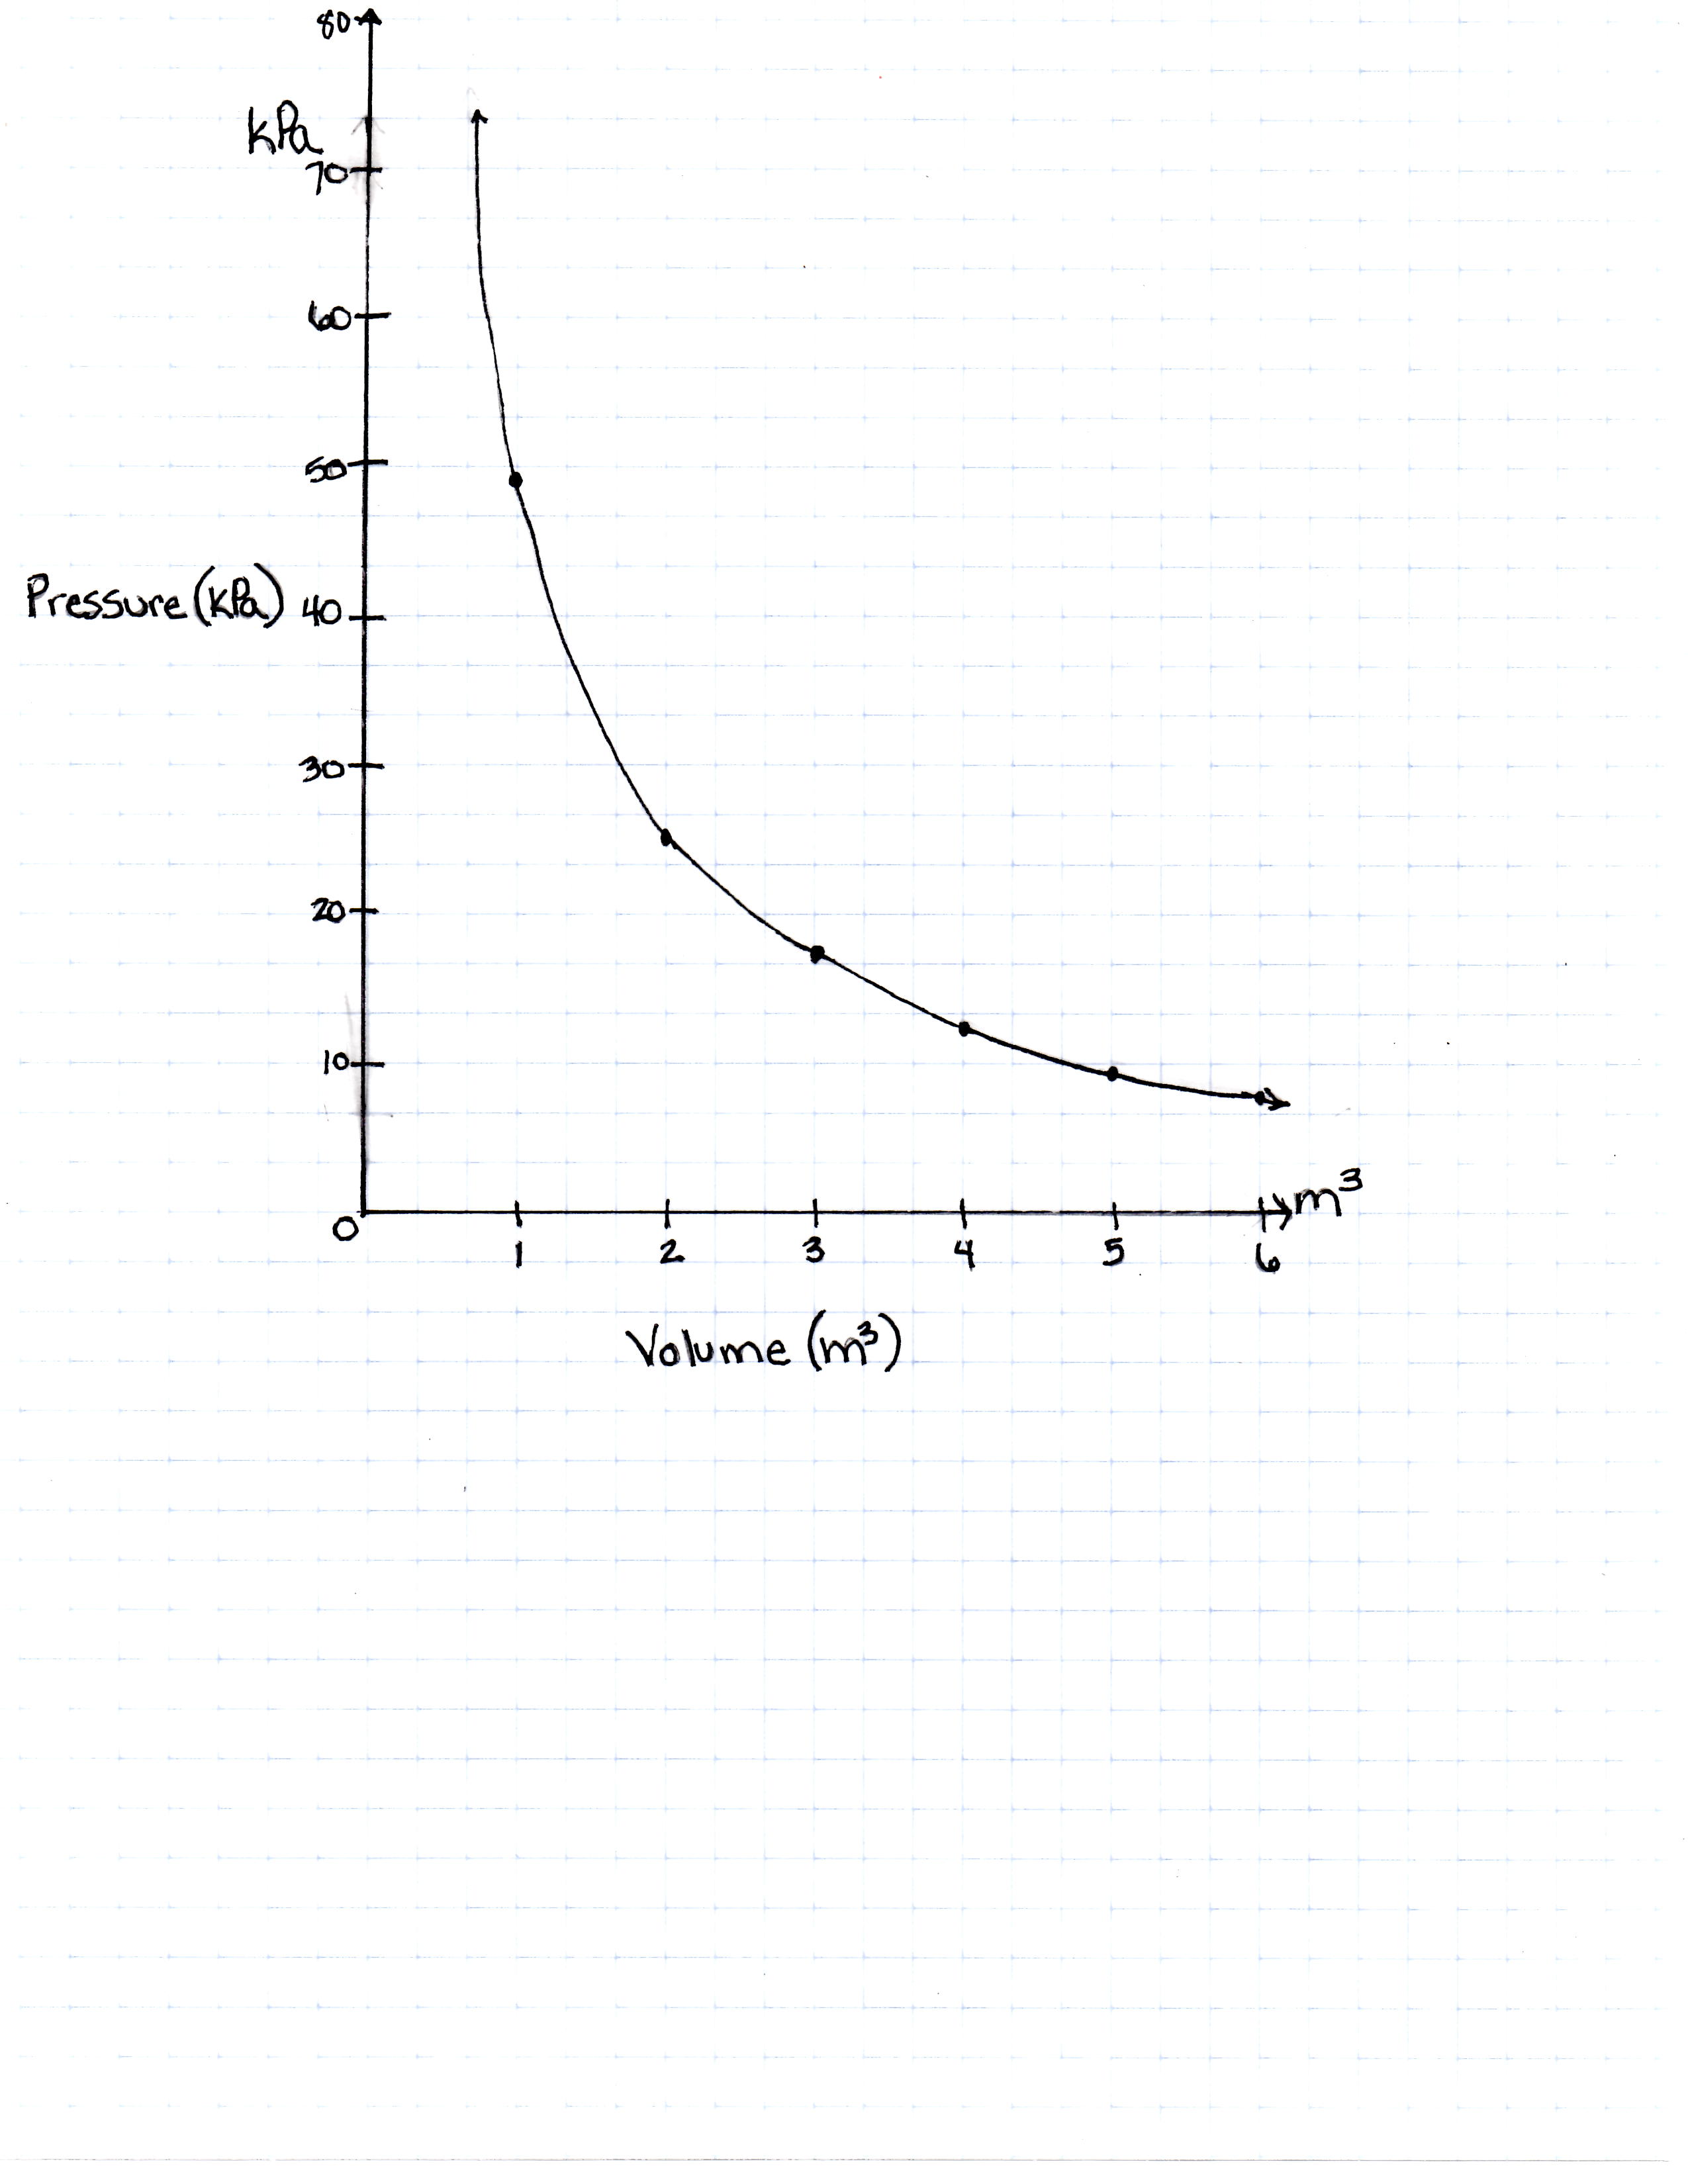
FIGURE 1
Will the pressure of a gas ever be  ?
?
The Ideal Gas Law is as follows:
A class of students began studying the Ideal Gas Law and how the Pressure and the Volume relate to one another. They took 20 moles of a sample gas and kept the room at a temperature of 300 Kelvin. They then used different sized containers of the gas to limit and expand the volume. At each different volume, they measure the pressure of the gas on its container. The table they made from their results is seen in table 1.
| Volume of the container | Pressure Measured in Pascals |
|---|---|
| 1 cubic meter | 49,884 Pascals |
| 2 cubic meters | 24,942 Pascals |
| 3 cubic meters | 16,628 Pascals |
| 4 cubic meters | 12,471 Pascals |
| 5 cubic meters | 9,976.8 Pascals |
| 6 cubic meters | 8,314 Pascals |
| 7 cubic meters | 7,126.2 Pascals |
TABLE 1
And they graph their findings in Figure 1.
FIGURE 1
Will the pressure of a gas ever be
The only way a gas can have a pressure of  is if there is no gas (0 moles) or if the temperature is 0 Kelvin. 0 Kelvin is absolute 0 and would mean that all movement of molecules has stopped and there is no pressure. Volume cannot be 0. If volume is 0, the equation cannot be solved because nothing is divisible by 0.
The only way a gas can have a pressure of
Compare your answer with the correct one above
The Ideal Gas Law is as follows:

 is pressure as measured in Pascals,
  is volume as measured in cubic meters,
  is the number of moles of the gas,
  is the gas constant known as 8.314 Joules per mole times Kelvin, and
  is the temperature measured in Kelvin.
A class of students began studying the Ideal Gas Law and how the Pressure and the Volume relate to one another. They took 20 moles of a sample gas and kept the room at a temperature of 300 Kelvin. They then used different sized containers of the gas to limit and expand the volume. At each different volume, they measure the pressure of the gas on its container. The table they made from their results is seen in table 1.
Volume of the container Pressure Measured in Pascals 1 cubic meter 49,884 Pascals 2 cubic meters 24,942 Pascals 3 cubic meters 16,628 Pascals 4 cubic meters 12,471 Pascals 5 cubic meters 9,976.8 Pascals 6 cubic meters 8,314 Pascals 7 cubic meters 7,126.2 Pascals
TABLE 1
And they graph their findings in Figure 1.
FIGURE 1
Will the graph ever cross the y-axis (the axis on which pressure is measured)?
The Ideal Gas Law is as follows:
A class of students began studying the Ideal Gas Law and how the Pressure and the Volume relate to one another. They took 20 moles of a sample gas and kept the room at a temperature of 300 Kelvin. They then used different sized containers of the gas to limit and expand the volume. At each different volume, they measure the pressure of the gas on its container. The table they made from their results is seen in table 1.
| Volume of the container | Pressure Measured in Pascals |
|---|---|
| 1 cubic meter | 49,884 Pascals |
| 2 cubic meters | 24,942 Pascals |
| 3 cubic meters | 16,628 Pascals |
| 4 cubic meters | 12,471 Pascals |
| 5 cubic meters | 9,976.8 Pascals |
| 6 cubic meters | 8,314 Pascals |
| 7 cubic meters | 7,126.2 Pascals |
TABLE 1
And they graph their findings in Figure 1.
FIGURE 1
Will the graph ever cross the y-axis (the axis on which pressure is measured)?
The lower the volume, the closer to the y-axis the graph will get, but it can never reach 0. If volume is measured at 0, the equation would have to be divided by 0. An equation cannot be divided by 0.
The lower the volume, the closer to the y-axis the graph will get, but it can never reach 0. If volume is measured at 0, the equation would have to be divided by 0. An equation cannot be divided by 0.
Compare your answer with the correct one above
The Ideal Gas Law is as follows:

 is pressure as measured in Pascals,
  is volume as measured in cubic meters,
  is the number of moles of the gas,
  is the gas constant known as 8.314 Joules per mole times Kelvin, and
  is the temperature measured in Kelvin.
A class of students began studying the Ideal Gas Law and how the Pressure and the Volume relate to one another. They took 20 moles of a sample gas and kept the room at a temperature of 300 Kelvin. They then used different sized containers of the gas to limit and expand the volume. At each different volume, they measure the pressure of the gas on its container. The table they made from their results is seen in table 1.
Volume of the container Pressure Measured in Pascals 1 cubic meter 49,884 Pascals 2 cubic meters 24,942 Pascals 3 cubic meters 16,628 Pascals 4 cubic meters 12,471 Pascals 5 cubic meters 9,976.8 Pascals 6 cubic meters 8,314 Pascals 7 cubic meters 7,126.2 Pascals
TABLE 1
And they graph their findings in Figure 1.
FIGURE 1
What is the pressure at temperature 0 Kelvin?
The Ideal Gas Law is as follows:
A class of students began studying the Ideal Gas Law and how the Pressure and the Volume relate to one another. They took 20 moles of a sample gas and kept the room at a temperature of 300 Kelvin. They then used different sized containers of the gas to limit and expand the volume. At each different volume, they measure the pressure of the gas on its container. The table they made from their results is seen in table 1.
| Volume of the container | Pressure Measured in Pascals |
|---|---|
| 1 cubic meter | 49,884 Pascals |
| 2 cubic meters | 24,942 Pascals |
| 3 cubic meters | 16,628 Pascals |
| 4 cubic meters | 12,471 Pascals |
| 5 cubic meters | 9,976.8 Pascals |
| 6 cubic meters | 8,314 Pascals |
| 7 cubic meters | 7,126.2 Pascals |
TABLE 1
And they graph their findings in Figure 1.
FIGURE 1
What is the pressure at temperature 0 Kelvin?
The temperature and pressure are directly proportional to one another. If the temperature reaches 0 Kelvin (which is absolute 0, the temperature at which molecules no longer move at all), there will be  of pressure because anything multiplied by 0 is 0.
The temperature and pressure are directly proportional to one another. If the temperature reaches 0 Kelvin (which is absolute 0, the temperature at which molecules no longer move at all), there will be
Compare your answer with the correct one above
The Ideal Gas Law is as follows:

 is pressure as measured in Pascals,
  is volume as measured in cubic meters,
  is the number of moles of the gas,
  is the gas constant known as 8.314 Joules per mole times Kelvin, and
  is the temperature measured in Kelvin.
A class of students began studying the Ideal Gas Law and how the Pressure and the Volume relate to one another. They took 20 moles of a sample gas and kept the room at a temperature of 300 Kelvin. They then used different sized containers of the gas to limit and expand the volume. At each different volume, they measure the pressure of the gas on its container. The table they made from their results is seen in table 1.
Temperature in Kelvin Pressure Measured in Pascals 200 Kelvin 16, 628 Pascals 400 Kelvin 33, 256 Pascals 600 Kelvin 49, 884 Pascals 800 Kelvin 66, 512 Pascals
TABLE 1
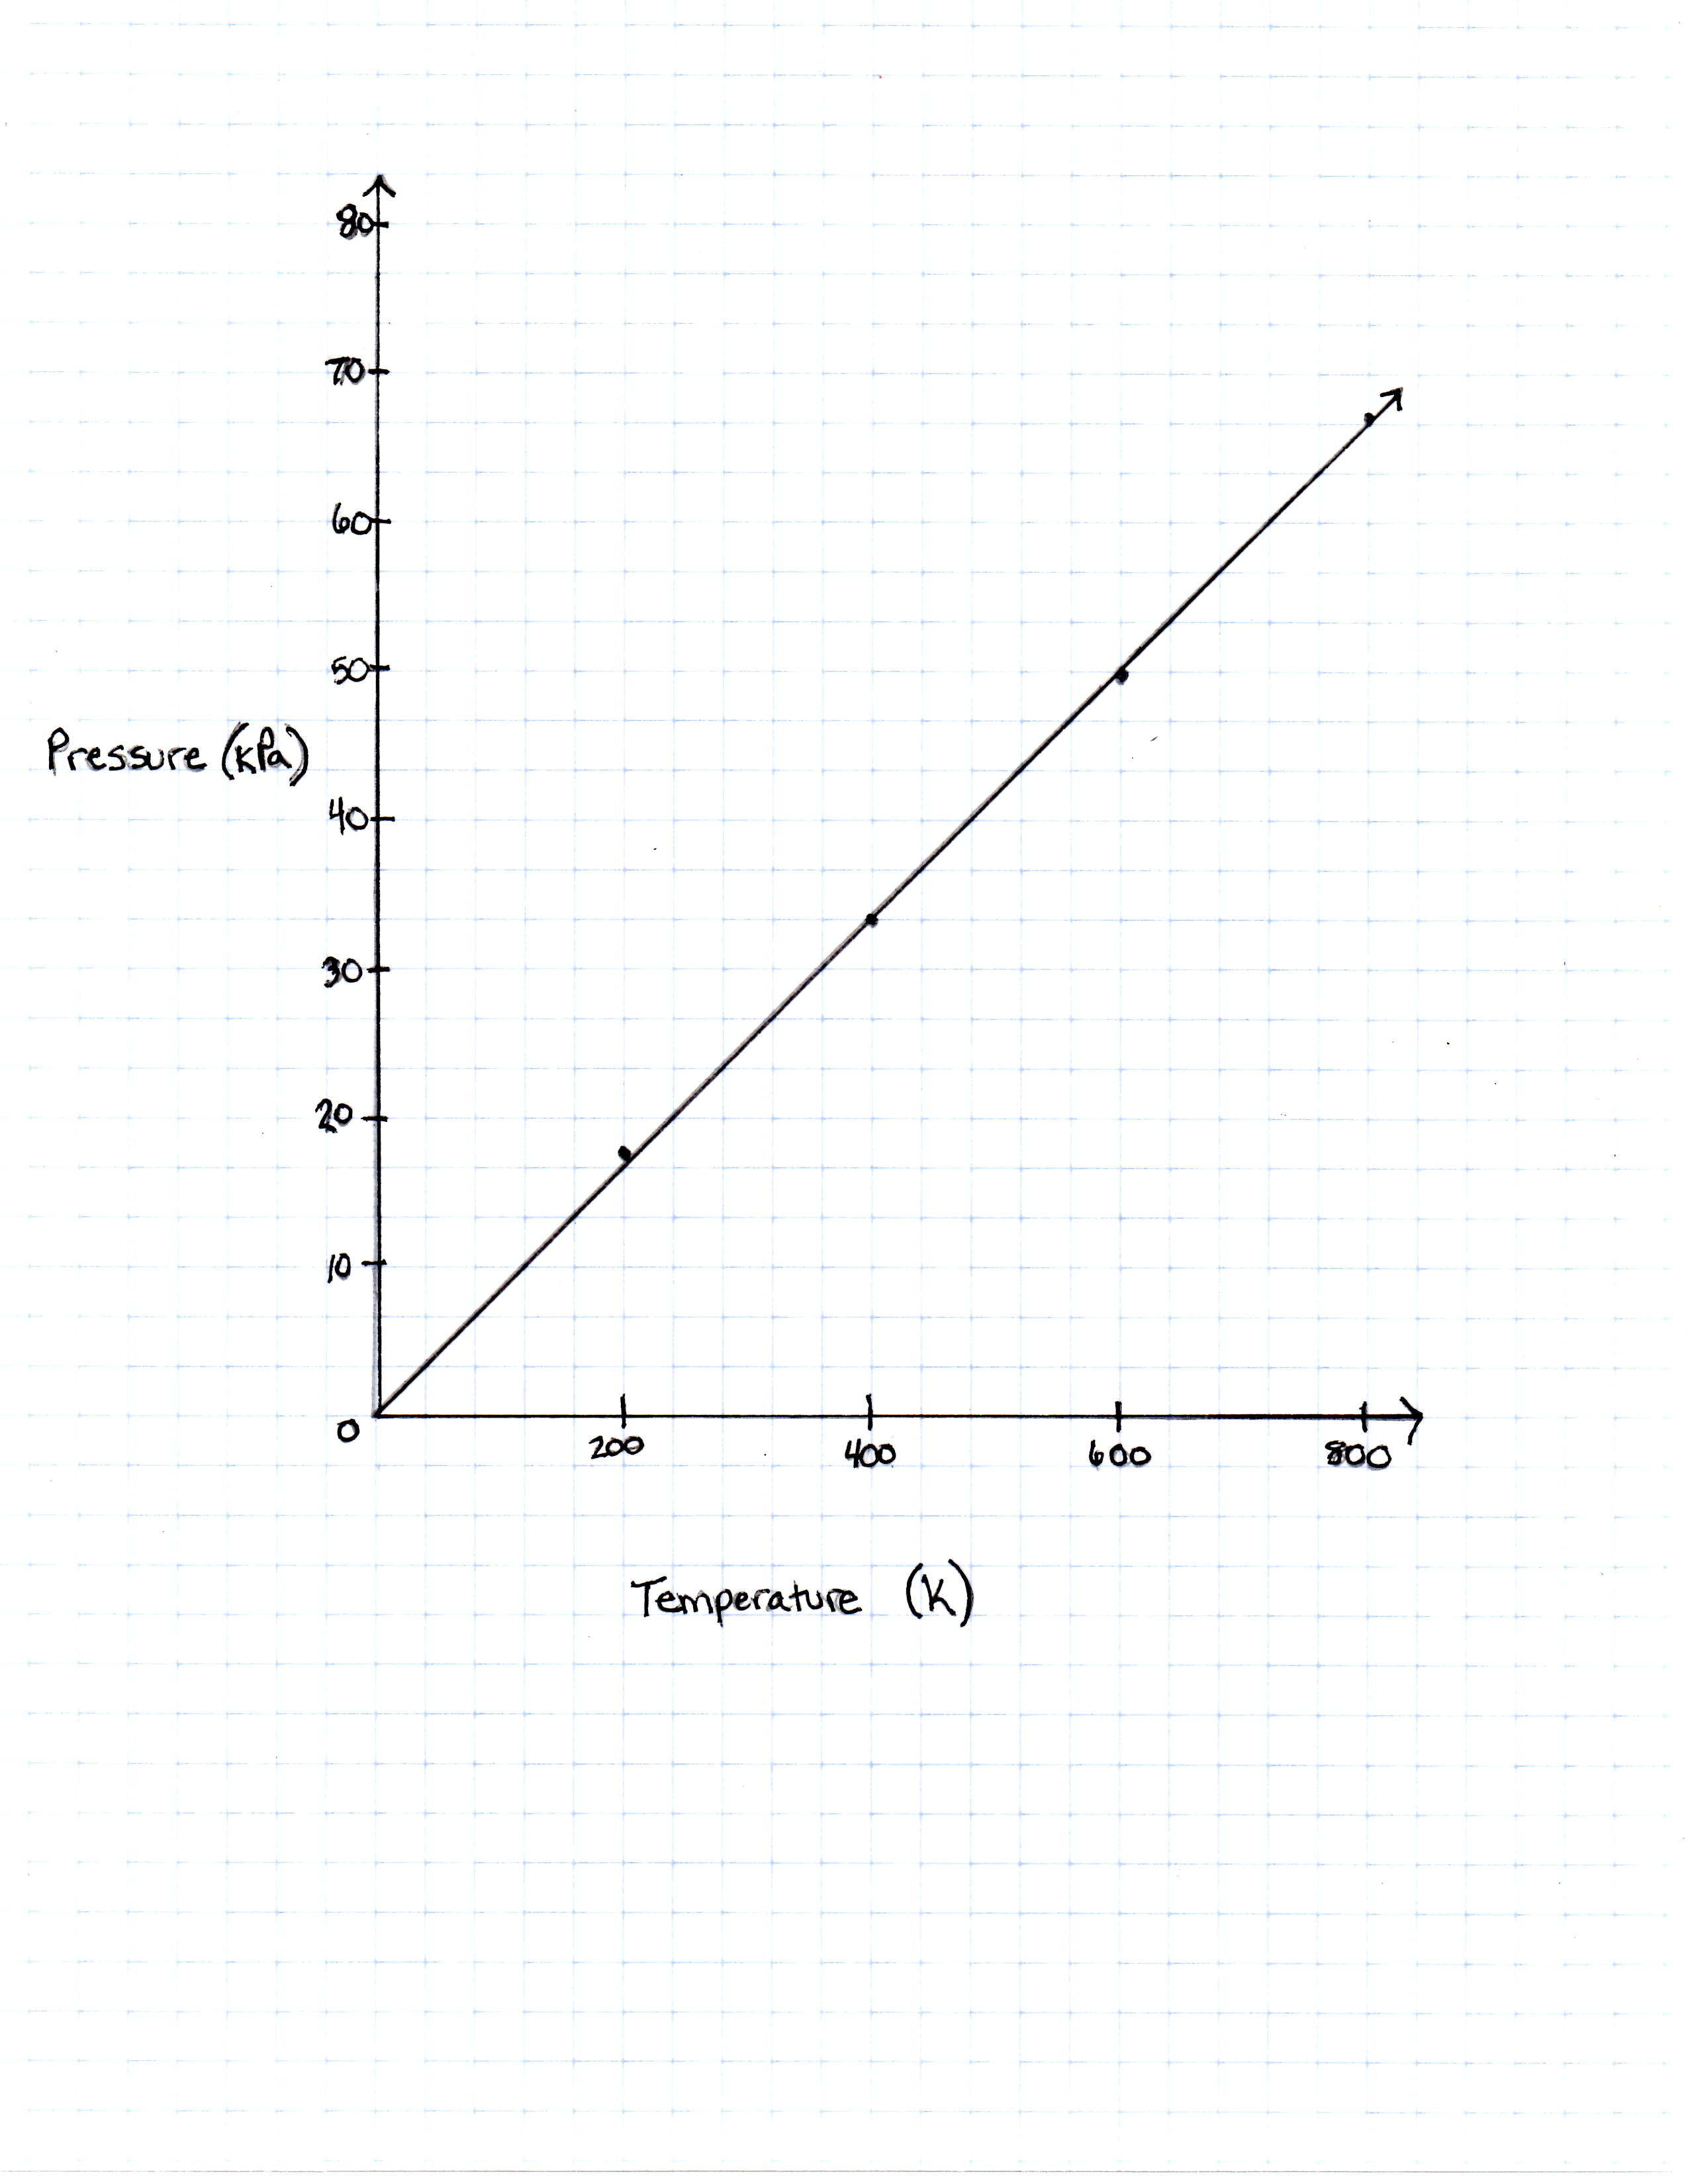
FIGURE 1
The graph the students made based on the data is seen in Figure 1.
Pressure is created by the movement of the gas molecules pushing against a container. 0 Kelvin is known as absolute 0, the temperature at which all molecule movement theoretically stops.
Describe the relationship between the temperature and the pressure.
The Ideal Gas Law is as follows:
A class of students began studying the Ideal Gas Law and how the Pressure and the Volume relate to one another. They took 20 moles of a sample gas and kept the room at a temperature of 300 Kelvin. They then used different sized containers of the gas to limit and expand the volume. At each different volume, they measure the pressure of the gas on its container. The table they made from their results is seen in table 1.
| Temperature in Kelvin | Pressure Measured in Pascals |
|---|---|
| 200 Kelvin | 16, 628 Pascals |
| 400 Kelvin | 33, 256 Pascals |
| 600 Kelvin | 49, 884 Pascals |
| 800 Kelvin | 66, 512 Pascals |
TABLE 1
FIGURE 1
The graph the students made based on the data is seen in Figure 1.
Pressure is created by the movement of the gas molecules pushing against a container. 0 Kelvin is known as absolute 0, the temperature at which all molecule movement theoretically stops.
Describe the relationship between the temperature and the pressure.
For every increase in temperature, there is a definite increase in pressure that can be found in the Ideal Gas Law equation. When the equation is solved for pressure
(20)}{2}(T)")
it can be thought of as the slope-intercept form of a line, with the y-intercept as 0 and the (20)}{2}") as the slope in front of the
as the slope in front of the  -coordinate, which in this case is temperature.
For every increase in temperature, there is a definite increase in pressure that can be found in the Ideal Gas Law equation. When the equation is solved for pressure
it can be thought of as the slope-intercept form of a line, with the y-intercept as 0 and the
Compare your answer with the correct one above
A student is choosing an enzyme to use in order to complete a chemical reaction. Based on the diagram of enzyme kinetics, which enzyme should the student use?
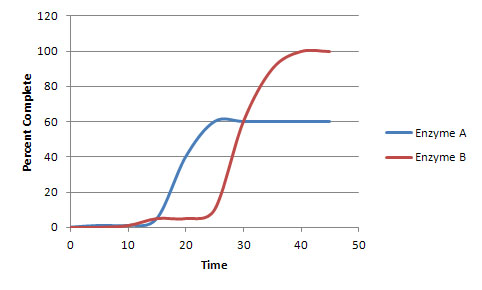
A student is choosing an enzyme to use in order to complete a chemical reaction. Based on the diagram of enzyme kinetics, which enzyme should the student use?
While Enzyme A has faster initial kinetics, it does not allow the reaction to reach completion. While slower, Enzyme B will allow the reaction to reach completion and should be used.
While Enzyme A has faster initial kinetics, it does not allow the reaction to reach completion. While slower, Enzyme B will allow the reaction to reach completion and should be used.
Compare your answer with the correct one above
A student is choosing an enzyme to use in order to complete a chemical reaction. Based on the diagram of enzyme kinetics, which enzyme is more efficient?
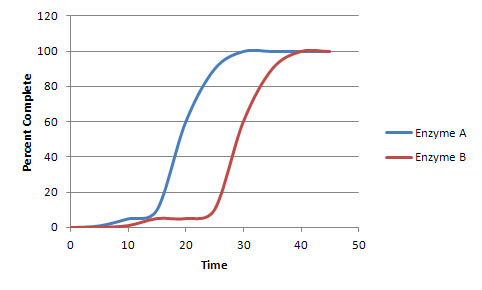
A student is choosing an enzyme to use in order to complete a chemical reaction. Based on the diagram of enzyme kinetics, which enzyme is more efficient?
In this example, both ezymes will catalyze the reaction to completion. However, Enzyme A will reach completion faster, indicating it is more efficient.
In this example, both ezymes will catalyze the reaction to completion. However, Enzyme A will reach completion faster, indicating it is more efficient.
Compare your answer with the correct one above
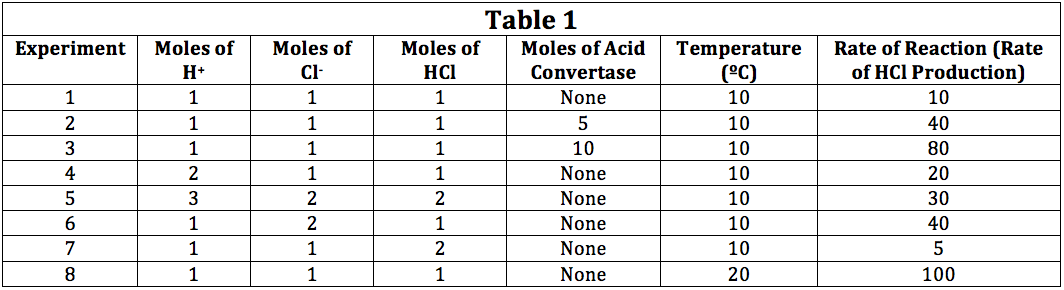
The rate of a reversible chemical reaction depends on many factors, including concentrations of the reactants and products, temperature, and presence of enzymes called catalysts. In the forward reaction, two reactants combine to form one product. However, in a reverse reaction, the product is broken down into the two reactants.
In order for a forward reaction to occur, the reactants moving around in the test tube must physically interact with each other. The more often reactants interact with each other, the more product is formed in the same amount of time. The speed at which reactants combine into products (the rate of the reaction) can be calculated by dividing the amount of a chemical produced in a reaction (often measured in moles) by the time it takes to produce that amount.
In order to determine the effects of reactant and product concentration, temperature, and presence of catalysts on the rate of a reaction, a scientist studied the following reaction:

The scientist varied the conditions of the experiment and measured the rate of the reaction. The results are outlined in Table 1. The units of concentration are moles per liter.
What is a possible unit of a rate of reaction?
The rate of a reversible chemical reaction depends on many factors, including concentrations of the reactants and products, temperature, and presence of enzymes called catalysts. In the forward reaction, two reactants combine to form one product. However, in a reverse reaction, the product is broken down into the two reactants.
In order for a forward reaction to occur, the reactants moving around in the test tube must physically interact with each other. The more often reactants interact with each other, the more product is formed in the same amount of time. The speed at which reactants combine into products (the rate of the reaction) can be calculated by dividing the amount of a chemical produced in a reaction (often measured in moles) by the time it takes to produce that amount.
In order to determine the effects of reactant and product concentration, temperature, and presence of catalysts on the rate of a reaction, a scientist studied the following reaction:
The scientist varied the conditions of the experiment and measured the rate of the reaction. The results are outlined in Table 1. The units of concentration are moles per liter.
What is a possible unit of a rate of reaction?
The passage describes that the reaction rate can be found by dividing the amount of chemicals produced in a reaction (moles) by the time it takes to produce them (seconds/minutes/hours/etc). The only answer choice that fits this pattern is moles/second. The other answer choices do contain the amount of chemicals produced but do not contain the time it takes to produce them.
The passage describes that the reaction rate can be found by dividing the amount of chemicals produced in a reaction (moles) by the time it takes to produce them (seconds/minutes/hours/etc). The only answer choice that fits this pattern is moles/second. The other answer choices do contain the amount of chemicals produced but do not contain the time it takes to produce them.
Compare your answer with the correct one above
The rate of a reversible chemical reaction depends on many factors, including concentrations of the reactants and products, temperature, and presence of enzymes called catalysts. In the forward reaction, two reactants combine to form one product. However, in a reverse reaction, the product is broken down into the two reactants.
In order for a forward reaction to occur, the reactants moving around in the test tube must physically interact with each other. The more often reactants interact with each other, the more produce is formed in the same amount of time. The speed at which reactants combine into products (the rate of the reaction) can be calculated by dividing the amount of a chemical produced in a reaction (often measured in moles) by the time it takes to produce that amount.
In order to determine the effects of reactant and product concentration, temperature, and presence of catalysts on the rate of a reaction, a scientist studied the following reaction:

The scientist varied the conditions of the experiment and measured the rate of the reaction. The results are outlined in Table 1. The units of concentration are moles per liter.
If the moles of acid convertase were doubled, how would the rate of reaction change?
The rate of a reversible chemical reaction depends on many factors, including concentrations of the reactants and products, temperature, and presence of enzymes called catalysts. In the forward reaction, two reactants combine to form one product. However, in a reverse reaction, the product is broken down into the two reactants.
In order for a forward reaction to occur, the reactants moving around in the test tube must physically interact with each other. The more often reactants interact with each other, the more produce is formed in the same amount of time. The speed at which reactants combine into products (the rate of the reaction) can be calculated by dividing the amount of a chemical produced in a reaction (often measured in moles) by the time it takes to produce that amount.
In order to determine the effects of reactant and product concentration, temperature, and presence of catalysts on the rate of a reaction, a scientist studied the following reaction:
The scientist varied the conditions of the experiment and measured the rate of the reaction. The results are outlined in Table 1. The units of concentration are moles per liter.
If the moles of acid convertase were doubled, how would the rate of reaction change?
According to Table 1, Experiments 2 and 3 show the moles of acid convertase doubling. The rate of the reaction, according to the final column, changes from 40 to 80, thus doubling.
According to Table 1, Experiments 2 and 3 show the moles of acid convertase doubling. The rate of the reaction, according to the final column, changes from 40 to 80, thus doubling.
Compare your answer with the correct one above
Chemists can model how solids, liquids, and gases behave at different temperatures and pressures with a graph called a phase diagram. When the pressure and temperature are simultaneously known, a scientist can predict whether the material will be in a specific state. The diagram is divided into sections depending on the phase and the lines between sections represent phase transitions occurring between two or more separate phases.
In general, solids of neatly stacked molecules exist when temperatures are low and pressures are intermediate. These values decrease the kinetic energy of the molecules enough to allow for attractive forces to begin the stacking process. Liquids, by contrast, are found at intermediate pressures and temperatures. The temperature is high enough to impart enough kinetic energy to prevent solid formation and the pressure is high enough to prevent the liquid from becoming a gas. Finally, a gas forms at low pressures and high temperatures. The high level of kinetic energy prevents molecules from associating with one another.
Materials can undergo processes called phase transitions, meaning they can transition from one phase to another. The transition from a solid to a liquid is called melting, while the reverse transition is called freezing. Vaporization occurs when a liquid becomes a gas, while condensation occurs when a gas becomes a liquid. Finally, in a process called sublimation, a solid can directly become a gas without passing through a liquid phase. Additionally, when a gas directly becomes a solid, this is known as deposition.
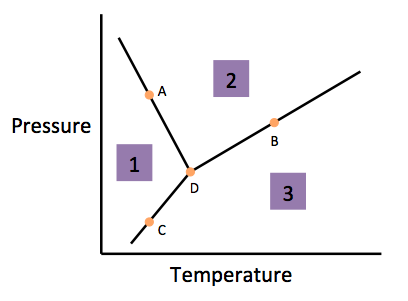
According to the figure, the material represented by Area 1 is in what phase?
Chemists can model how solids, liquids, and gases behave at different temperatures and pressures with a graph called a phase diagram. When the pressure and temperature are simultaneously known, a scientist can predict whether the material will be in a specific state. The diagram is divided into sections depending on the phase and the lines between sections represent phase transitions occurring between two or more separate phases.
In general, solids of neatly stacked molecules exist when temperatures are low and pressures are intermediate. These values decrease the kinetic energy of the molecules enough to allow for attractive forces to begin the stacking process. Liquids, by contrast, are found at intermediate pressures and temperatures. The temperature is high enough to impart enough kinetic energy to prevent solid formation and the pressure is high enough to prevent the liquid from becoming a gas. Finally, a gas forms at low pressures and high temperatures. The high level of kinetic energy prevents molecules from associating with one another.
Materials can undergo processes called phase transitions, meaning they can transition from one phase to another. The transition from a solid to a liquid is called melting, while the reverse transition is called freezing. Vaporization occurs when a liquid becomes a gas, while condensation occurs when a gas becomes a liquid. Finally, in a process called sublimation, a solid can directly become a gas without passing through a liquid phase. Additionally, when a gas directly becomes a solid, this is known as deposition.
According to the figure, the material represented by Area 1 is in what phase?
According to paragraph two, solids are sets of neatly stacked molecules and exist when temperatures are low and pressures are intermediate. Looking at our figure, we can see that at low temperatures (towards the origin) and intermediate pressures, we are looking at area one. Thus, area one must be in the solid phase.
According to paragraph two, solids are sets of neatly stacked molecules and exist when temperatures are low and pressures are intermediate. Looking at our figure, we can see that at low temperatures (towards the origin) and intermediate pressures, we are looking at area one. Thus, area one must be in the solid phase.
Compare your answer with the correct one above
Chemists can model how solids, liquids, and gases behave at different temperatures and pressures with a graph called a phase diagram. When the pressure and temperature are simultaneously known, a scientist can predict whether the material will be in a specific state. The diagram is divided into sections depending on the phase and the lines between sections represent phase transitions occurring between two or more separate phases.
In general, solids of neatly stacked molecules exist when temperatures are low and pressures are intermediate. These values decrease the kinetic energy of the molecules enough to allow for attractive forces to begin the stacking process. Liquids, by contrast, are found at intermediate pressures and temperatures. The temperature is high enough to impart enough kinetic energy to prevent solid formation and the pressure is high enough to prevent the liquid from becoming a gas. Finally, a gas forms at low pressures and high temperatures. The high level of kinetic energy prevents molecules from associating with one another.
Materials can undergo processes called phase transitions, meaning they can transition from one phase to another. The transition from a solid to a liquid is called melting, while the reverse transition is called freezing. Vaporization occurs when a liquid becomes a gas, while condensation occurs when a gas becomes a liquid. Finally, in a process called sublimation, a solid can directly become a gas without passing through a liquid phase. Additionally, when a gas directly becomes a solid, this is known as deposition.
According to the figure, the material represented by area two is in what phase?
According to paragraph two, liquids are found at intermediate pressures and temperatures. The only section on the graph that corresponds to intermediate pressures and temperatures is area two.
According to paragraph two, liquids are found at intermediate pressures and temperatures. The only section on the graph that corresponds to intermediate pressures and temperatures is area two.
Compare your answer with the correct one above
Chemists can model how solids, liquids, and gases behave at different temperatures and pressures with a graph called a phase diagram. When the pressure and temperature are simultaneously known, a scientist can predict whether the material will be in a specific state. The diagram is divided into sections depending on the phase and the lines between sections represent phase transitions occurring between two or more separate phases.
In general, solids of neatly stacked molecules exist when temperatures are low and pressures are intermediate. These values decrease the kinetic energy of the molecules enough to allow for attractive forces to begin the stacking process. Liquids, by contrast, are found at intermediate pressures and temperatures. The temperature is high enough to impart enough kinetic energy to prevent solid formation and the pressure is high enough to prevent the liquid from becoming a gas. Finally, a gas forms at low pressures and high temperatures. The high level of kinetic energy prevents molecules from associating with one another.
Materials can undergo processes called phase transitions, meaning they can transition from one phase to another. The transition from a solid to a liquid is called melting, while the reverse transition is called freezing. Vaporization occurs when a liquid becomes a gas, while condensation occurs when a gas becomes a liquid. Finally, in a process called sublimation, a solid can directly become a gas without passing through a liquid phase. Additionally, when a gas directly becomes a solid, this is known as deposition.
According to the figure, the material represented by area three is in what phase?
According to paragraph two, gas exists at low pressures and high temperatures. Looking for area three on the figure, we see that this region corresponds to low pressures and high temperatures and thus must represent the gaseous state.
According to paragraph two, gas exists at low pressures and high temperatures. Looking for area three on the figure, we see that this region corresponds to low pressures and high temperatures and thus must represent the gaseous state.
Compare your answer with the correct one above
Both gases and liquids are considered to be fluids that have individual molecules that move around with kinetic and potential energy. Kinetic energy, defined as the energy related to motion, takes three forms: translational energy that occurs as a molecule moves from position A to position B, rotational energy that occurs as a molecule spins around an imaginary axis at its center of mass, and vibrational energy that occurs as individual atoms in a molecular bond move towards and away from each other. Usually, molecules possess varying combinations of kinetic energy forms. In contrast, potential energy is defined as stored energy that could be released to become kinetic energy. The total energy of a molecule is fixed, meaning that a molecule has some combination of kinetic and potential energies.
Varying amount of kinetic and potential energies define how molecules in a fluid interact with each other. For example, when the kinetic energy of a molecule is high (greater than 1000J), it can no longer interact with neighboring molecules strongly enough to remain a liquid. However, if the potential energies are too high (greater than 1000 J), molecules cannot escape a liquid to become a gas. If the kinetic energy is high and the potential energy is low, molecules tend to become a gas and can be modeled by an equation known as the Ideal Gas Law:

Where P is the pressure of a gas, V is the volume, n is the number of moles of a gas, R is a constant, and T is temperature in degrees Kelvin.
The Ideal Gas Law perfectly applies to particles with no mass, no intermolecular interactions, and no true volume. However, real molecules do not adhere perfectly to the Ideal Gas Law.
At a constant pressure, the relationship between volume and temperature may best be shown as:
Both gases and liquids are considered to be fluids that have individual molecules that move around with kinetic and potential energy. Kinetic energy, defined as the energy related to motion, takes three forms: translational energy that occurs as a molecule moves from position A to position B, rotational energy that occurs as a molecule spins around an imaginary axis at its center of mass, and vibrational energy that occurs as individual atoms in a molecular bond move towards and away from each other. Usually, molecules possess varying combinations of kinetic energy forms. In contrast, potential energy is defined as stored energy that could be released to become kinetic energy. The total energy of a molecule is fixed, meaning that a molecule has some combination of kinetic and potential energies.
Varying amount of kinetic and potential energies define how molecules in a fluid interact with each other. For example, when the kinetic energy of a molecule is high (greater than 1000J), it can no longer interact with neighboring molecules strongly enough to remain a liquid. However, if the potential energies are too high (greater than 1000 J), molecules cannot escape a liquid to become a gas. If the kinetic energy is high and the potential energy is low, molecules tend to become a gas and can be modeled by an equation known as the Ideal Gas Law:
Where P is the pressure of a gas, V is the volume, n is the number of moles of a gas, R is a constant, and T is temperature in degrees Kelvin.
The Ideal Gas Law perfectly applies to particles with no mass, no intermolecular interactions, and no true volume. However, real molecules do not adhere perfectly to the Ideal Gas Law.
At a constant pressure, the relationship between volume and temperature may best be shown as:
Using the passage, we can see that, at a constant pressure, volume and temperature are both in the numerator on opposite sides of the equals sign. Thus, we can say that they are directly related to each other. The figure that best illustrates this relationship is one that is a linear, positively sloped curve.
Using the passage, we can see that, at a constant pressure, volume and temperature are both in the numerator on opposite sides of the equals sign. Thus, we can say that they are directly related to each other. The figure that best illustrates this relationship is one that is a linear, positively sloped curve.
Compare your answer with the correct one above
Both gases and liquids are considered to be fluids that have individual molecules that move around with kinetic and potential energy. Kinetic energy, defined as the energy related to motion, takes three forms: translational energy that occurs as a molecule moves from position A to position B, rotational energy that occurs as a molecule spins around an imaginary axis at its center of mass, and vibrational energy that occurs as individual atoms in a molecular bond move towards and away from each other. Usually, molecules possess varying combinations of kinetic energy forms. In contrast, potential energy is defined as stored energy that could be released to become kinetic energy. The total energy of a molecule is fixed, meaning that a molecule has some combination of kinetic and potential energies.
Varying amount of kinetic and potential energies define how molecules in a fluid interact with each other. For example, when the kinetic energy of a molecule is high (greater than 1000J), it can no longer interact with neighboring molecules strongly enough to remain a liquid. However, if the potential energies are too high (greater than 1000 J), molecules cannot escape a liquid to become a gas. If the kinetic energy is high and the potential energy is low, molecules tend to become a gas and can be modeled by an equation known as the Ideal Gas Law:
Where P is the pressure of a gas, V is the volume, n is the number of moles of a gas, R is a constant, and T is temperature in degrees Kelvin.
The Ideal Gas Law perfectly applies to particles with no mass, no intermolecular interactions, and no true volume. However, real molecules do not adhere perfectly to the Ideal Gas Law.
At a constant pressure and volume, the relationship between the number of moles and temperature may best be modeled as:
Using the formula as a guide, we can see that number of moles and temperature are on the same side of the equals sign, indicating that they are inversly proportaion. If we rearrange the equation, we can see that:  . This more clearly indicates the inverse relationship. This is illustrated by a curve with a negative slope that is linear.
Using the formula as a guide, we can see that number of moles and temperature are on the same side of the equals sign, indicating that they are inversly proportaion. If we rearrange the equation, we can see that:
Compare your answer with the correct one above
Current high levels of fossil fuel use, including coal-burning power plants and gasoline-powered automobiles, have helped contribute to the high concentrations of sulfur trioxide, SO3, found in the atmosphere. When sulfur trioxide and water interact, they can undergo the following chemical reaction to produce sulfuric acid, which is the main contributor to acid rain worldwide:

Acid rain showers are particularly common near coal-burning power plants and large cities. These showers are responsible for significant economic damage to sidewalks, roads, and buildings. Scientists interested in studying the effects of acid rain often use basic substances like calcium carbonate, the main component of limestone buildings, and expose them to varying volumes of acid rain to determine what volume of acid rain is necessary to begin to erode a building. A sample graph of one scientist’s experiment is replicated below:
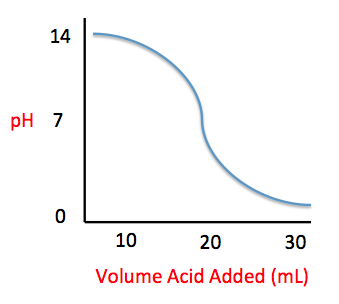
Measuring acid and base levels is commonly done with a scale called pH, which uses the concentration of hydrogen ions to determine the acidity. Hydrogen ions are in a balance with hydroxide ions to give a scale with a range from 0 to 14. Values equal to or between 0 and 6.9 represent the acidic range where hydrogen ions predominate and values equal to or ranging from 7.1 and 14 represent the basic range where hydroxide ions predominate. Thus, the more hydrogen ions present, the more acidic the solution.
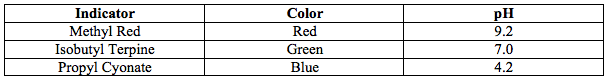
Scientists can tell when a titration (pH) experiment passes a certain pH using compounds called indicators. Indicators are usually colorless at pH levels below that of their specified color change. A table of indicators used by the above scientists and the pH at which they change colors is presented below.
What is the pH of a solution containing calcium carbonate and sulfuric acid when 15 mL of sulfuric acid have been added?
Current high levels of fossil fuel use, including coal-burning power plants and gasoline-powered automobiles, have helped contribute to the high concentrations of sulfur trioxide, SO3, found in the atmosphere. When sulfur trioxide and water interact, they can undergo the following chemical reaction to produce sulfuric acid, which is the main contributor to acid rain worldwide:
Acid rain showers are particularly common near coal-burning power plants and large cities. These showers are responsible for significant economic damage to sidewalks, roads, and buildings. Scientists interested in studying the effects of acid rain often use basic substances like calcium carbonate, the main component of limestone buildings, and expose them to varying volumes of acid rain to determine what volume of acid rain is necessary to begin to erode a building. A sample graph of one scientist’s experiment is replicated below:
Measuring acid and base levels is commonly done with a scale called pH, which uses the concentration of hydrogen ions to determine the acidity. Hydrogen ions are in a balance with hydroxide ions to give a scale with a range from 0 to 14. Values equal to or between 0 and 6.9 represent the acidic range where hydrogen ions predominate and values equal to or ranging from 7.1 and 14 represent the basic range where hydroxide ions predominate. Thus, the more hydrogen ions present, the more acidic the solution.
Scientists can tell when a titration (pH) experiment passes a certain pH using compounds called indicators. Indicators are usually colorless at pH levels below that of their specified color change. A table of indicators used by the above scientists and the pH at which they change colors is presented below.
What is the pH of a solution containing calcium carbonate and sulfuric acid when 15 mL of sulfuric acid have been added?
This question asks us to use the provided figure to estimate the pH of a solution given an amount of acid added. Using the curve, we can see that a 15 mL addition of sulfuric acid corresponds to a pH of roughly 10. While we not be able to determine the exact number, we can use process of elimination with the answer choices to see which of the options presented is close to the number represented on the figure.
This question asks us to use the provided figure to estimate the pH of a solution given an amount of acid added. Using the curve, we can see that a 15 mL addition of sulfuric acid corresponds to a pH of roughly 10. While we not be able to determine the exact number, we can use process of elimination with the answer choices to see which of the options presented is close to the number represented on the figure.
Compare your answer with the correct one above
Current high levels of fossil fuel use, including coal-burning power plants and gasoline-powered automobiles, have helped contribute to the high concentrations of sulfur trioxide, SO3, found in the atmosphere. When sulfur trioxide and water interact, they can undergo the following chemical reaction to produce sulfuric acid, which is the main contributor to acid rain worldwide:
Acid rain showers are particularly common near coal-burning power plants and large cities. These showers are responsible for significant economic damage to sidewalks, roads, and buildings. Scientists interested in studying the effects of acid rain often use basic substances like calcium carbonate, the main component of limestone buildings, and expose them to varying volumes of acid rain to determine what volume of acid rain is necessary to begin to erode a building. A sample graph of one scientist’s experiment is replicated below:
Measuring acid and base levels is commonly done with a scale called pH, which uses the concentration of hydrogen ions to determine the acidity. Hydrogen ions are in a balance with hydroxide ions to give a scale with a range from 0 to 14. Values equal to or between 0 and 6.9 represent the acidic range where hydrogen ions predominate and values equal to or ranging from 7.1 and 14 represent the basic range where hydroxide ions predominate. Thus, the more hydrogen ions present, the more acidic the solution.
Scientists can tell when a titration (pH) experiment passes a certain pH using compounds called indicators. Indicators are usually colorless at pH levels below that of their specified color change. A table of indicators used by the above scientists and the pH at which they change colors is presented below.
What is the pH of a solution containing calcium carbonate and sulfuric acid when 20 mL of sulfuric acid have been added?
This question asks us to use the provided figure to determine the average pH of a solution in the titration explained in the passage. We can see that when 20 mL of sulfuric acid have been added to the calcium carbonate solution, the resulting pH falls in the middle of the sigmoidal curve at a pH of around 7. These problems are important to understand because the ACT tends to test the interpretation of figures and charts heavily.
This question asks us to use the provided figure to determine the average pH of a solution in the titration explained in the passage. We can see that when 20 mL of sulfuric acid have been added to the calcium carbonate solution, the resulting pH falls in the middle of the sigmoidal curve at a pH of around 7. These problems are important to understand because the ACT tends to test the interpretation of figures and charts heavily.
Compare your answer with the correct one above
Current high levels of fossil fuel use, including coal-burning power plants and gasoline-powered automobiles, have helped contribute to the high concentrations of sulfur trioxide, SO3, found in the atmosphere. When sulfur trioxide and water interact, they can undergo the following chemical reaction to produce sulfuric acid, which is the main contributor to acid rain worldwide:
Acid rain showers are particularly common near coal-burning power plants and large cities. These showers are responsible for significant economic damage to sidewalks, roads, and buildings. Scientists interested in studying the effects of acid rain often use basic substances like calcium carbonate, the main component of limestone buildings, and expose them to varying volumes of acid rain to determine what volume of acid rain is necessary to begin to erode a building. A sample graph of one scientist’s experiment is replicated below:
Measuring acid and base levels is commonly done with a scale called pH, which uses the concentration of hydrogen ions to determine the acidity. Hydrogen ions are in a balance with hydroxide ions to give a scale with a range from 0 to 14. Values equal to or between 0 and 6.9 represent the acidic range where hydrogen ions predominate and values equal to or ranging from 7.1 and 14 represent the basic range where hydroxide ions predominate. Thus, the more hydrogen ions present, the more acidic the solution.
Scientists can tell when a titration (pH) experiment passes a certain pH using compounds called indicators. Indicators are usually colorless at pH levels below that of their specified color change. A table of indicators used by the above scientists and the pH at which they change colors is presented below.
What is the pH of a solution containing calcium carbonate and sulfuric acid when 29 mL of sulfuric acid have been added?
In this question, we are asked to determine the relationship between pH and volume of sulfuric acid added to the basic solution. This is best done by using the graph provided in the passage. We can see that, as we add more sulfuric acid, the pH of the solution decreases. Around an addition of 30 mL, we can see that the pH of the solution is beginning to approach 0. Given the range of answer choices provided, we can estimate that addition of 29 mL would give a pH of around 0.
In this question, we are asked to determine the relationship between pH and volume of sulfuric acid added to the basic solution. This is best done by using the graph provided in the passage. We can see that, as we add more sulfuric acid, the pH of the solution decreases. Around an addition of 30 mL, we can see that the pH of the solution is beginning to approach 0. Given the range of answer choices provided, we can estimate that addition of 29 mL would give a pH of around 0.
Compare your answer with the correct one above
Current high levels of fossil fuel use, including coal-burning power plants and gasoline-powered automobiles, have helped contribute to the high concentrations of sulfur trioxide, SO3, found in the atmosphere. When sulfur trioxide and water interact, they can undergo the following chemical reaction to produce sulfuric acid, which is the main contributor to acid rain worldwide:
Acid rain showers are particularly common near coal-burning power plants and large cities. These showers are responsible for significant economic damage to sidewalks, roads, and buildings. Scientists interested in studying the effects of acid rain often use basic substances like calcium carbonate, the main component of limestone buildings, and expose them to varying volumes of acid rain to determine what volume of acid rain is necessary to begin to erode a building. A sample graph of one scientist’s experiment is replicated below:
Measuring acid and base levels is commonly done with a scale called pH, which uses the concentration of hydrogen ions to determine the acidity. Hydrogen ions are in a balance with hydroxide ions to give a scale with a range from 0 to 14. Values equal to or between 0 and 6.9 represent the acidic range where hydrogen ions predominate and values equal to or ranging from 7.1 and 14 represent the basic range where hydroxide ions predominate. Thus, the more hydrogen ions present, the more acidic the solution.
Scientists can tell when a titration (pH) experiment passes a certain pH using compounds called indicators. Indicators are usually colorless at pH levels below that of their specified color change. A table of indicators used by the above scientists and the pH at which they change colors is presented below.
The relationship between pH and volume of acid added can best be described as which of the following?
In general, the ACT asks students to identify four different types of graphs - directly proportional, inversely proportional, indirectly proportional, and sigmoidal. As the name implies sigmoidal graphs have an "S" shape. Directly proportional graphs are presented as a positive-slope straight line, while the opposite is true for inversely proportional. Indirectly proportional graphs do not present the relationship between two variables as a straight line. Instead the line may be exponential or logarithmic.
In general, the ACT asks students to identify four different types of graphs - directly proportional, inversely proportional, indirectly proportional, and sigmoidal. As the name implies sigmoidal graphs have an "S" shape. Directly proportional graphs are presented as a positive-slope straight line, while the opposite is true for inversely proportional. Indirectly proportional graphs do not present the relationship between two variables as a straight line. Instead the line may be exponential or logarithmic.
Compare your answer with the correct one above
Current high levels of fossil fuel use, including coal-burning power plants and gasoline-powered automobiles, have helped contribute to the high concentrations of sulfur trioxide, SO3, found in the atmosphere. When sulfur trioxide and water interact, they can undergo the following chemical reaction to produce sulfuric acid, which is the main contributor to acid rain worldwide:
Acid rain showers are particularly common near coal-burning power plants and large cities. These showers are responsible for significant economic damage to sidewalks, roads, and buildings. Scientists interested in studying the effects of acid rain often use basic substances like calcium carbonate, the main component of limestone buildings, and expose them to varying volumes of acid rain to determine what volume of acid rain is necessary to begin to erode a building. A sample graph of one scientist’s experiment is replicated below:
Measuring acid and base levels is commonly done with a scale called pH, which uses the concentration of hydrogen ions to determine the acidity. Hydrogen ions are in a balance with hydroxide ions to give a scale with a range from 0 to 14. Values equal to or between 0 and 6.9 represent the acidic range where hydrogen ions predominate and values equal to or ranging from 7.1 and 14 represent the basic range where hydroxide ions predominate. Thus, the more hydrogen ions present, the more acidic the solution.
Scientists can tell when a titration (pH) experiment passes a certain pH using compounds called indicators. Indicators are usually colorless at pH levels below that of their specified color change. A table of indicators used by the above scientists and the pH at which they change colors is presented below.
Solutions A, B, and C each contain a different number of hydrogen ions. Solution A has a pH of 6.9, solution B has a pH of 7.3, and solution C has a pH of 1.3. Place the solutions in order of increasing number of hydrogen ions.
The passage describes that pH indicates the relative number of hydrogen ions present in a solution. We know that more ions are present when the pH is the lowest. Thus, using the pH values provided in the question along with the information contained in the passage, we can place the solutions in decending order with respect to their pH, which is equivalent to listing them in increasing hydrogen number.
The passage describes that pH indicates the relative number of hydrogen ions present in a solution. We know that more ions are present when the pH is the lowest. Thus, using the pH values provided in the question along with the information contained in the passage, we can place the solutions in decending order with respect to their pH, which is equivalent to listing them in increasing hydrogen number.
Compare your answer with the correct one above
The Millikin oil drop experiment is among the most important experiments in the history of science. It was used to determine one of the fundamental constants of the universe, the charge on the electron. For his work, Robert Millikin won the Nobel Prize in Physics in 1923.
Millikin used an experimental setup as follows in Figure 1. He opened a chamber of oil into an adjacent uniform electric field. The oil droplets sank into the electric field once the trap door opened, but were then immediately suspended by the forces of electricity present in the field.
Figure 1:
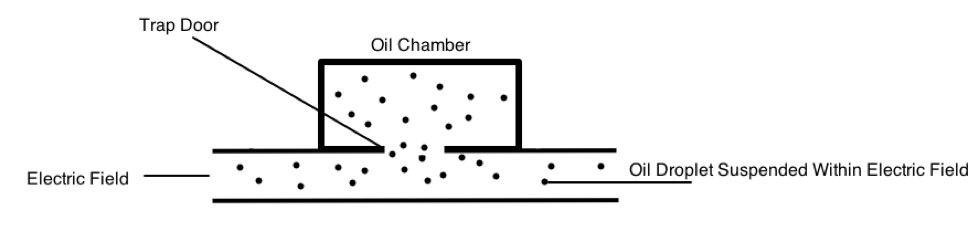
By determining how much force was needed to exactly counteract the gravity pulling the oil droplet down, Millikin was able to determine the force of electricity. This is depicted in Figure 2.
Using this information, he was able to calculate the exact charge on an electron. By changing some conditions, such as creating a vacuum in the apparatus, the experiment can be modified.
Figure 2:
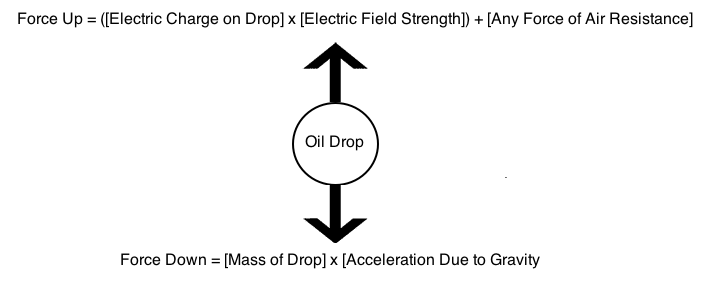
When the drop is suspended perfectly, the total forces up equal the total forces down. Because Millikin knew the electric field in the apparatus, the force of air resistance, the mass of the drop, and the acceleration due to gravity, he was able to solve the following equation:

 + [Air\hspace{1mm}Resistance] = [Mass] x [Acceleration\hspace{1mm}from\hspace{1mm}Gravity]")
 - [Air Resistance]}{Electric\hspace{1mm}Field}")
Table 1 summarizes the electric charge found on oil drops in suspension. Millikin correctly concluded that the calculated charges must all be multiples of the fundamental charge of the electron. A hypothetical oil drop contains some net charge due to lost electrons, and this net charge cannot be smaller than the charge on a single electron.
Table 1:
Trial # Electric Charge Calculated in Coulombs (C) Vacuum Used? 1 1.602176487 x 10⁻⁸ No 2 1.602176487 x 10⁻² Yes 3 1.602176487 x 10⁻⁶ No 4 1.602176487 x 10⁻⁴ Yes
Based on Figure 2, an increase on the mass of an oil drop being studied would ______ the acceleration due to gravity?
The Millikin oil drop experiment is among the most important experiments in the history of science. It was used to determine one of the fundamental constants of the universe, the charge on the electron. For his work, Robert Millikin won the Nobel Prize in Physics in 1923.
Millikin used an experimental setup as follows in Figure 1. He opened a chamber of oil into an adjacent uniform electric field. The oil droplets sank into the electric field once the trap door opened, but were then immediately suspended by the forces of electricity present in the field.
Figure 1:
By determining how much force was needed to exactly counteract the gravity pulling the oil droplet down, Millikin was able to determine the force of electricity. This is depicted in Figure 2.
Using this information, he was able to calculate the exact charge on an electron. By changing some conditions, such as creating a vacuum in the apparatus, the experiment can be modified.
Figure 2:
When the drop is suspended perfectly, the total forces up equal the total forces down. Because Millikin knew the electric field in the apparatus, the force of air resistance, the mass of the drop, and the acceleration due to gravity, he was able to solve the following equation:
Table 1 summarizes the electric charge found on oil drops in suspension. Millikin correctly concluded that the calculated charges must all be multiples of the fundamental charge of the electron. A hypothetical oil drop contains some net charge due to lost electrons, and this net charge cannot be smaller than the charge on a single electron.
Table 1:
| Trial # | Electric Charge Calculated in Coulombs (C) | Vacuum Used? |
|---|---|---|
| 1 | 1.602176487 x 10⁻⁸ | No |
| 2 | 1.602176487 x 10⁻² | Yes |
| 3 | 1.602176487 x 10⁻⁶ | No |
| 4 | 1.602176487 x 10⁻⁴ | Yes |
Based on Figure 2, an increase on the mass of an oil drop being studied would ______ the acceleration due to gravity?
The acceleration due to gravity and the mass are two distinct variables in the equation presented in Figure 2. Increasing the mass would increase the overall force in the downward direction, but would not increase the acceleration due to gravity.
The acceleration due to gravity and the mass are two distinct variables in the equation presented in Figure 2. Increasing the mass would increase the overall force in the downward direction, but would not increase the acceleration due to gravity.
Compare your answer with the correct one above